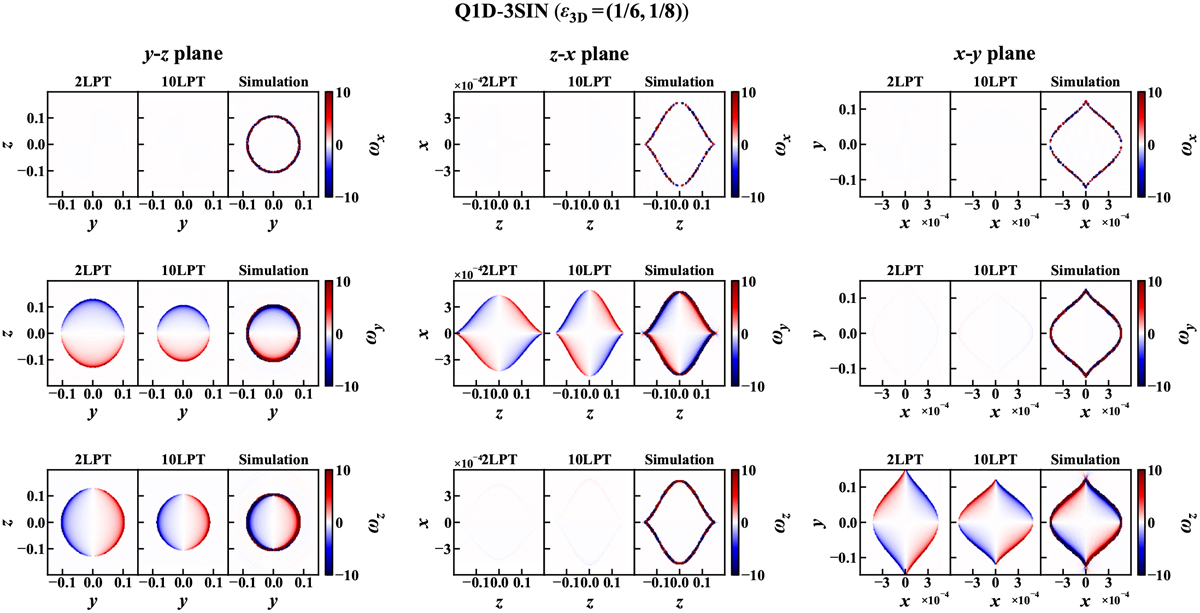
Fig. 16
Download original image
Vorticity components shortly after the shell-crossing: comparison of LPT with the ballistic approximation with Vlasov runs for Q1D-3SIN. The 2D slices are the same as those shown in the top-left group of nine panels of Fig. 14, except that the slice changes from left to right and the vorticity component changes from top to bottom. Again, on each line of three panels, 2LPT (left panel) and 1OLPT (middle panel) are compared with simulation measurements (rightpanel).
Current usage metrics show cumulative count of Article Views (full-text article views including HTML views, PDF and ePub downloads, according to the available data) and Abstracts Views on Vision4Press platform.
Data correspond to usage on the plateform after 2015. The current usage metrics is available 48-96 hours after online publication and is updated daily on week days.
Initial download of the metrics may take a while.