Fig. 14
Download original image
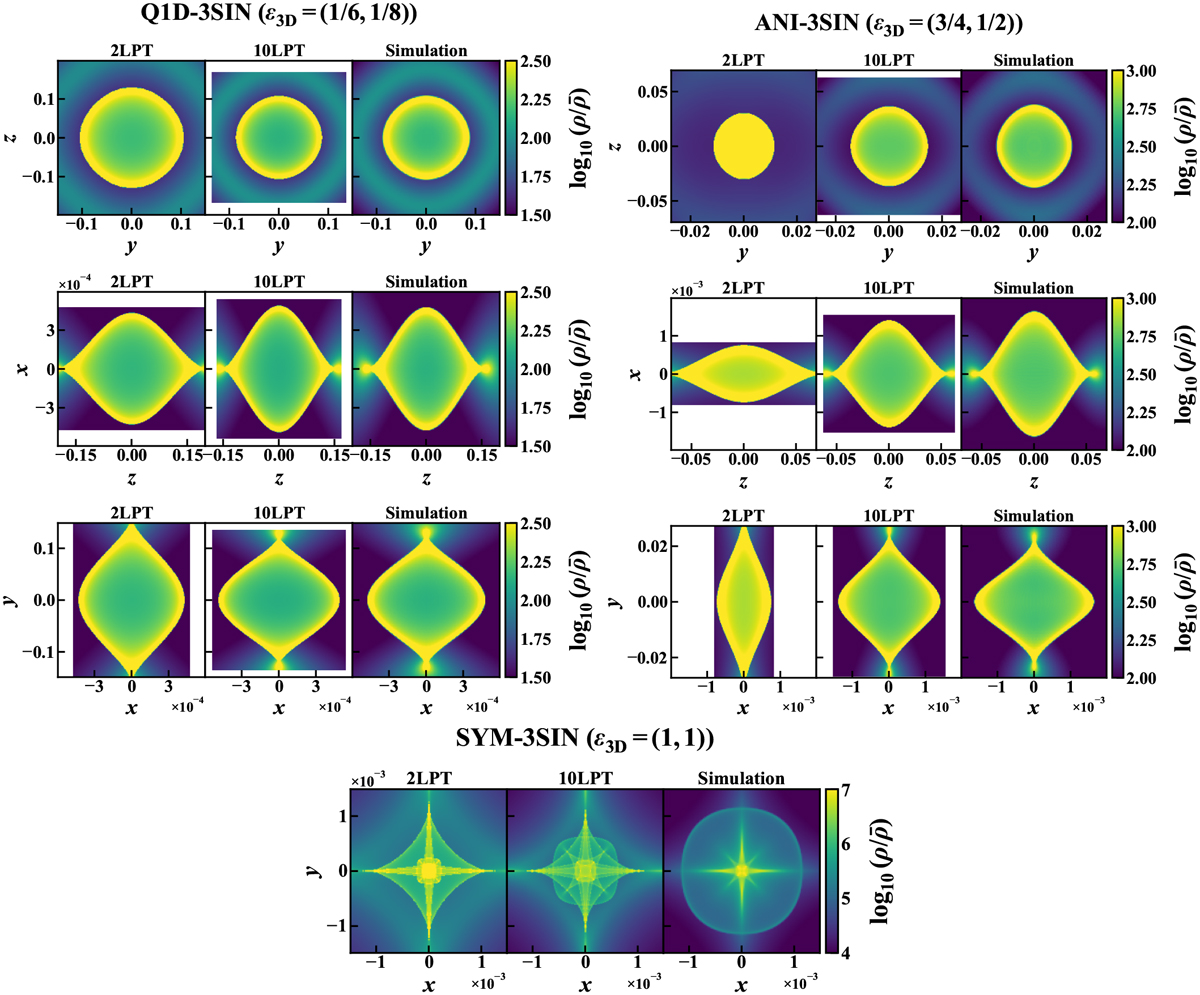
Slices of the projected density shortly after the shell-crossing: comparison of LPT using ballistic approximation with Vlasov runs. The left and right groups of nine panels correspond respectively to Q1D-3SIN (top, middle, and bottom line of panels: x=−1.55×l0−4, y = −1.17×10⁻³, and z= −1.56 × 10⁻³ slice) and ANI-3SIN (x= −5.16 × 10⁻⁴, y = −2.15 × 10⁻⁴, and z= −5.47 × 10⁻⁴ slice), while the bottom group of three panels corresponds to SYM-3SIN (z= −1.17 × 10⁻⁵ slice). In each group of panels, the left, middle, and right columns give respectively the second-order LPT prediction, the tenth-order LPT prediction, and the Vlasov code measurements. Due to the symmetry of the system for SYM-3SIN, only one slice is shown for the bottom panels.
Current usage metrics show cumulative count of Article Views (full-text article views including HTML views, PDF and ePub downloads, according to the available data) and Abstracts Views on Vision4Press platform.
Data correspond to usage on the plateform after 2015. The current usage metrics is available 48-96 hours after online publication and is updated daily on week days.
Initial download of the metrics may take a while.