Fig. 1
Download original image
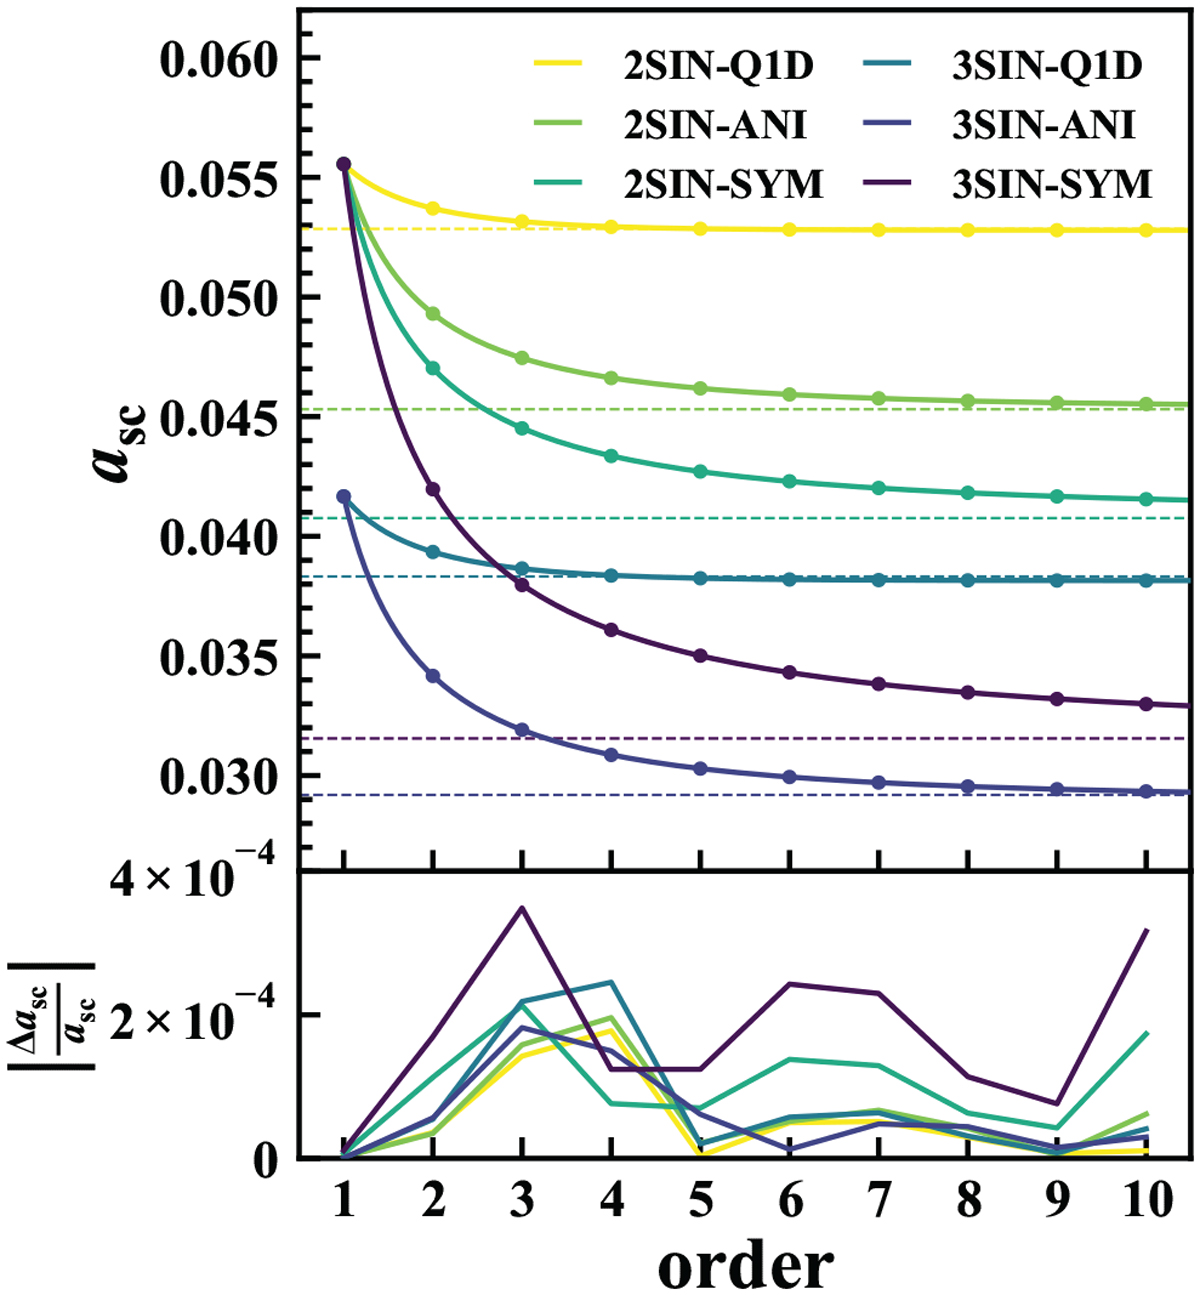
Convergence behaviour of the shell-crossing time. Top: shell-crossing time calculated at nth-order LPT (dots), together with the fitting function given by Eq. (34) (solid lines), as a function of the perturbation order for various initial conditions, as indicated in the panel. The dashed horizontal lines present the values estimated from the simulations (see Appendix B.1), corresponding to the sixth column of Table 1. Bottom: relative error between the shell-crossing time calculated with nth-order LPT and the one obtained with the fitting formula.
Current usage metrics show cumulative count of Article Views (full-text article views including HTML views, PDF and ePub downloads, according to the available data) and Abstracts Views on Vision4Press platform.
Data correspond to usage on the plateform after 2015. The current usage metrics is available 48-96 hours after online publication and is updated daily on week days.
Initial download of the metrics may take a while.