Fig. 5.
Download original image
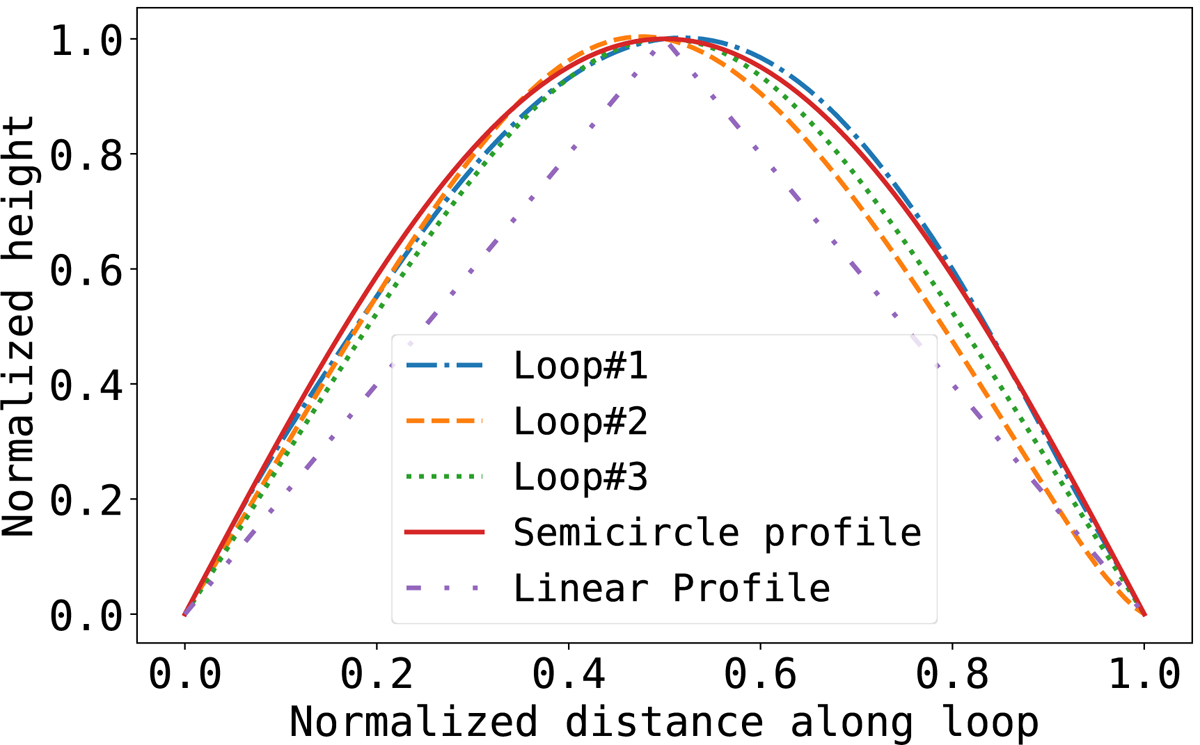
Different geometries of the coronal loop. The purple dash-dot-dotted line and red solid line represent the linear and semi-circular loop geometry, respectively. The blue dash-dotted line, orange dashed line, and green dotted line represent the real loop geometry of Loops #1, #2, and #3, respectively. The apex positions of the real loops slightly deviate from the midpoint (x = 0.5), and the profiles of the coronal loops match the semi-circle loop geometry well.
Current usage metrics show cumulative count of Article Views (full-text article views including HTML views, PDF and ePub downloads, according to the available data) and Abstracts Views on Vision4Press platform.
Data correspond to usage on the plateform after 2015. The current usage metrics is available 48-96 hours after online publication and is updated daily on week days.
Initial download of the metrics may take a while.