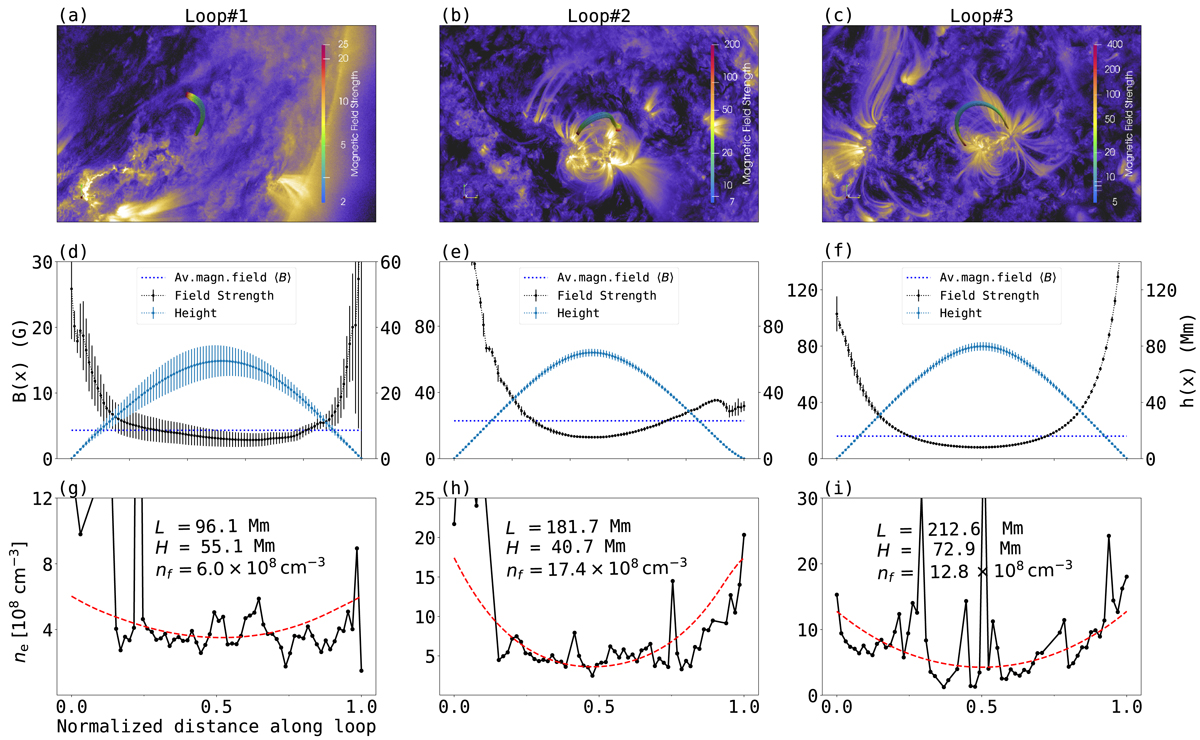
Fig. 3.
Download original image
Reconstructed coronal loops and the distribution of their physical parameters. Panels a–c: 3D structure of the magnetic field from a potential field model with the background of the 171 Å waveband on 2010 October 16, 2011 September 6, and 2012 March 7, respectively. Panels d–f: corresponding height (black filled dot), the distribution of the magnetic field strength (blue filled dot) along the loop length, and the average magnetic field strength (blue dashed line). Panels g–i: corresponding electron density (black solid line) and the fitting curve (red dashed line).
Current usage metrics show cumulative count of Article Views (full-text article views including HTML views, PDF and ePub downloads, according to the available data) and Abstracts Views on Vision4Press platform.
Data correspond to usage on the plateform after 2015. The current usage metrics is available 48-96 hours after online publication and is updated daily on week days.
Initial download of the metrics may take a while.