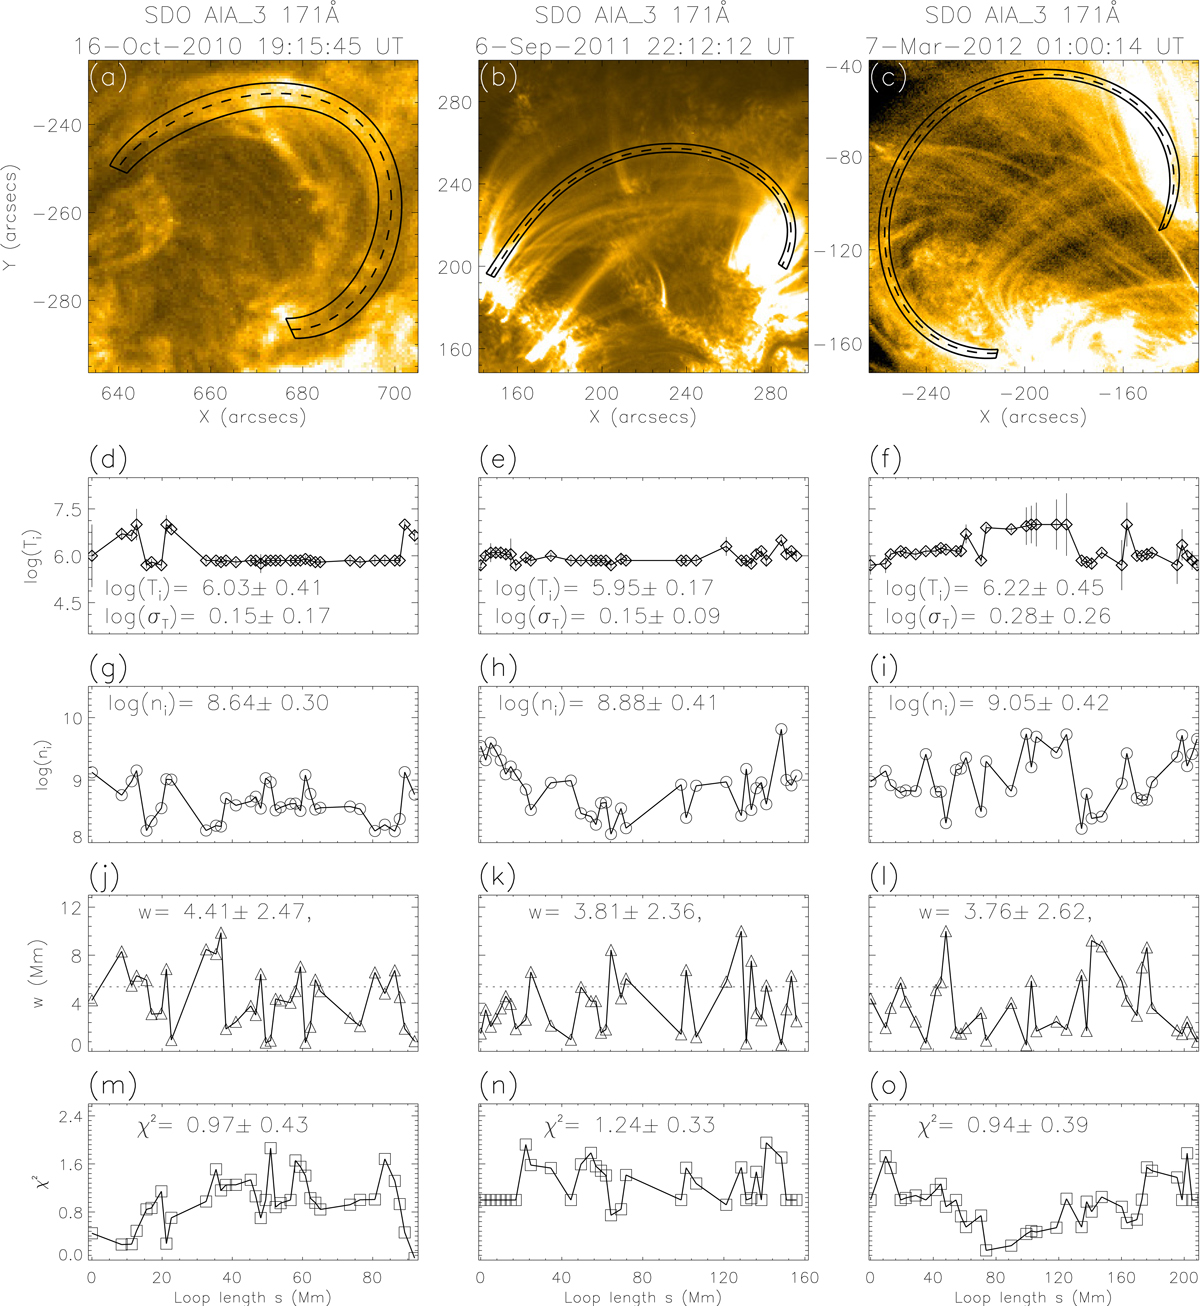
Fig. 2.
Download original image
Loop tracing and DEM analysis of the three selected loops. The columns from left to right show the results of Loop #1, Loop #2, and Loop #3, respectively. Panels a–c: loop geometry (dashed line) and their widths (solid line) in 171 Å images. Panels d–f: temperature distribution along the loop geometry. Panels g–i: density distribution along the loop geometry. Panels j–l: width variation along the loop geometry. Panels m–o: goodness of the fitting.
Current usage metrics show cumulative count of Article Views (full-text article views including HTML views, PDF and ePub downloads, according to the available data) and Abstracts Views on Vision4Press platform.
Data correspond to usage on the plateform after 2015. The current usage metrics is available 48-96 hours after online publication and is updated daily on week days.
Initial download of the metrics may take a while.