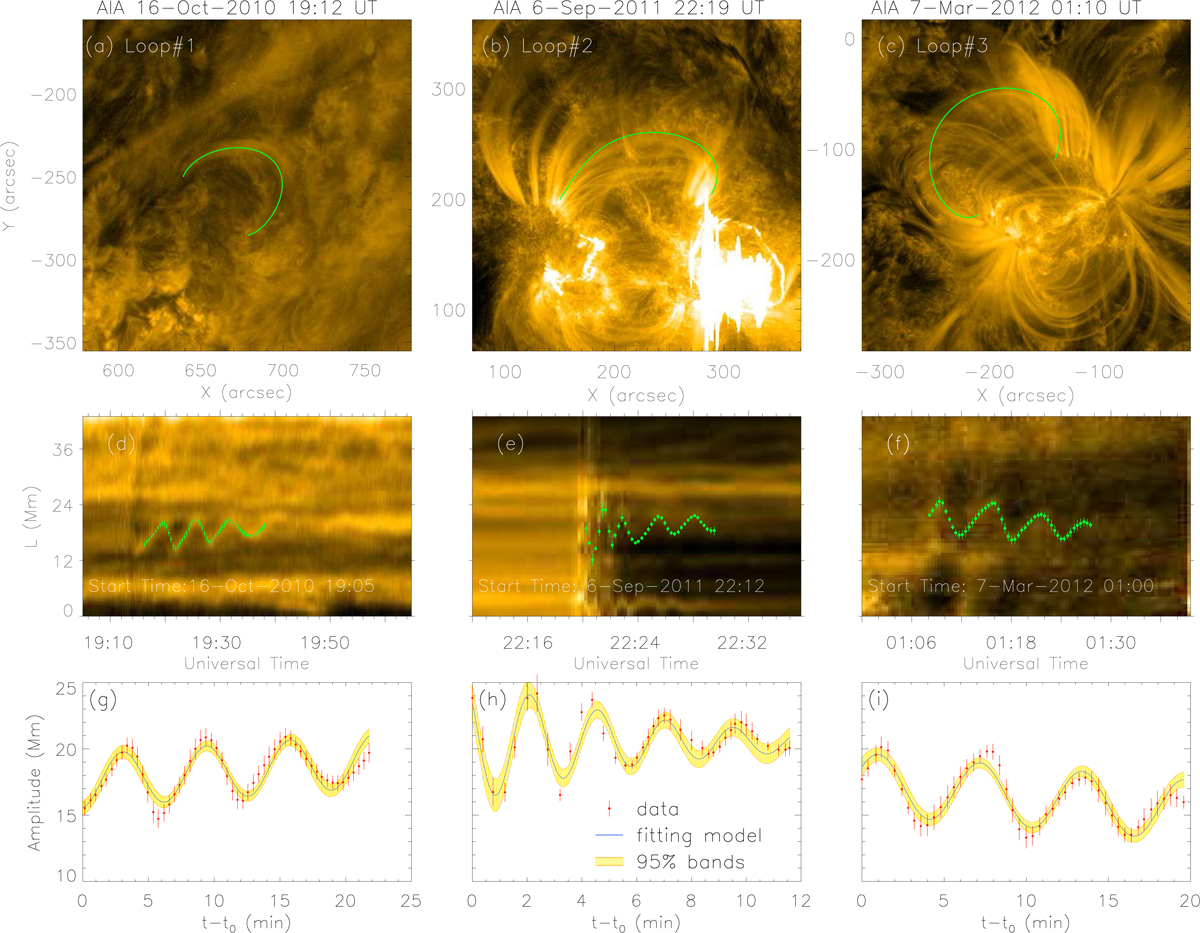
Fig. 1.
Download original image
Measurements and fittings of the three selected coronal loops. The columns, from left to right, represent Loop #1, Loop #2, and Loop #3, respectively. Panels a–c: location of the coronal loop. The green solid line shows the path of the loop. Panels d–f: oscillation profiles. The green filled dots are the sampling points of the oscillation profile. Panels g–i: fitting results. The red points with error bars are the aforementioned data points, the blue solid line is the fitting model and the orange region is the confidence band of 95%.
Current usage metrics show cumulative count of Article Views (full-text article views including HTML views, PDF and ePub downloads, according to the available data) and Abstracts Views on Vision4Press platform.
Data correspond to usage on the plateform after 2015. The current usage metrics is available 48-96 hours after online publication and is updated daily on week days.
Initial download of the metrics may take a while.