Fig. 7
Download original image
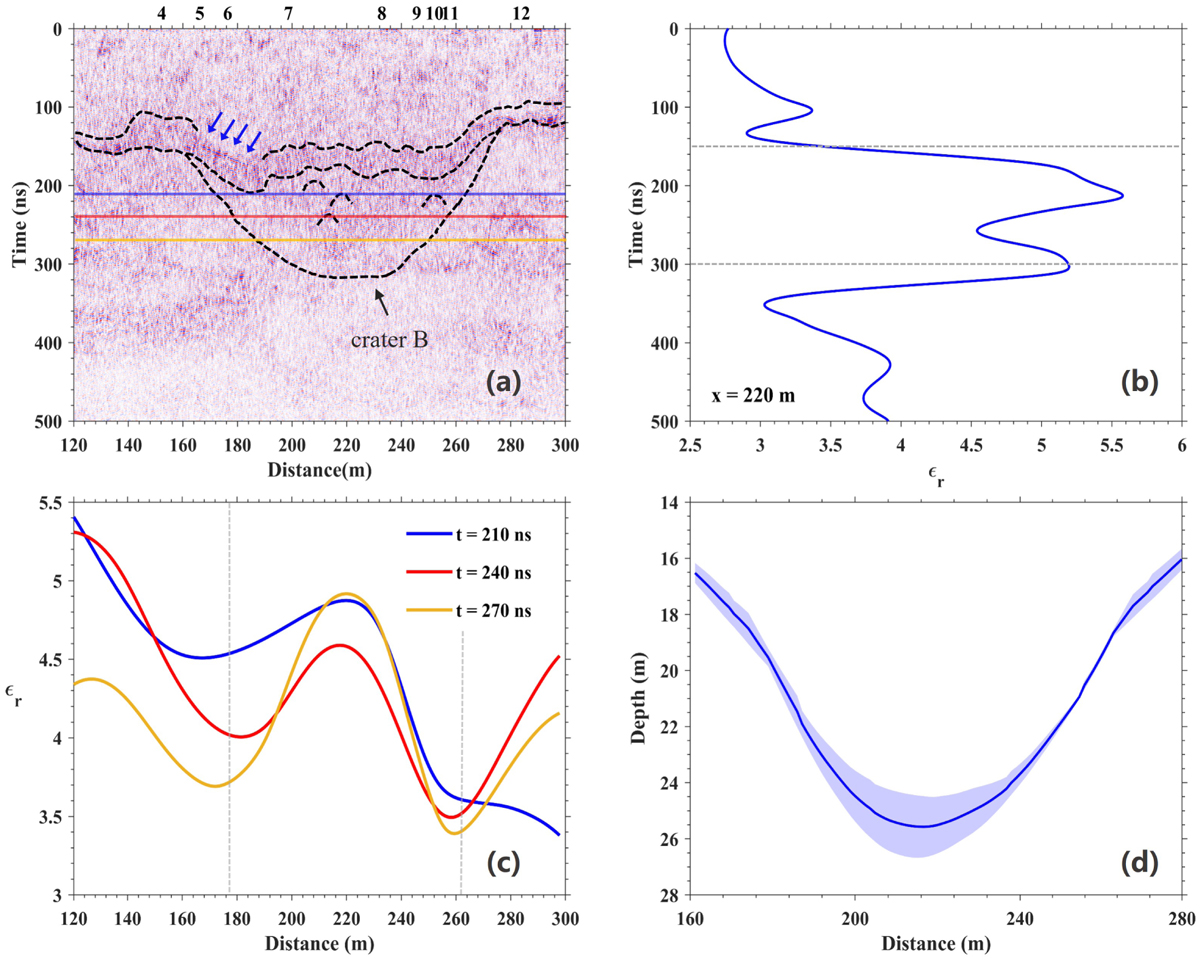
Radargram, relative permittivity, and absolute depths of the crater B. (a) Radar profile of crater B. The colour bar represents the amplitude of the radar signals. Black dashed lines show the outlines of layered structures and crater B, and discrete scatterers. Blue arrows point to a sharp reflection. (b) Permittivity varied with depth at x = 220 m. (c) Permittivity varied with horizontal distance at three time delays (blue, red and yellow line) in a; the time delays are at t = 210 ns, t = 240 ns, and t = 270 ns, respectively. (d) Absolute depths of the outline of crater B and its error bar (blue shaded area).
Current usage metrics show cumulative count of Article Views (full-text article views including HTML views, PDF and ePub downloads, according to the available data) and Abstracts Views on Vision4Press platform.
Data correspond to usage on the plateform after 2015. The current usage metrics is available 48-96 hours after online publication and is updated daily on week days.
Initial download of the metrics may take a while.