Fig. 6
Download original image
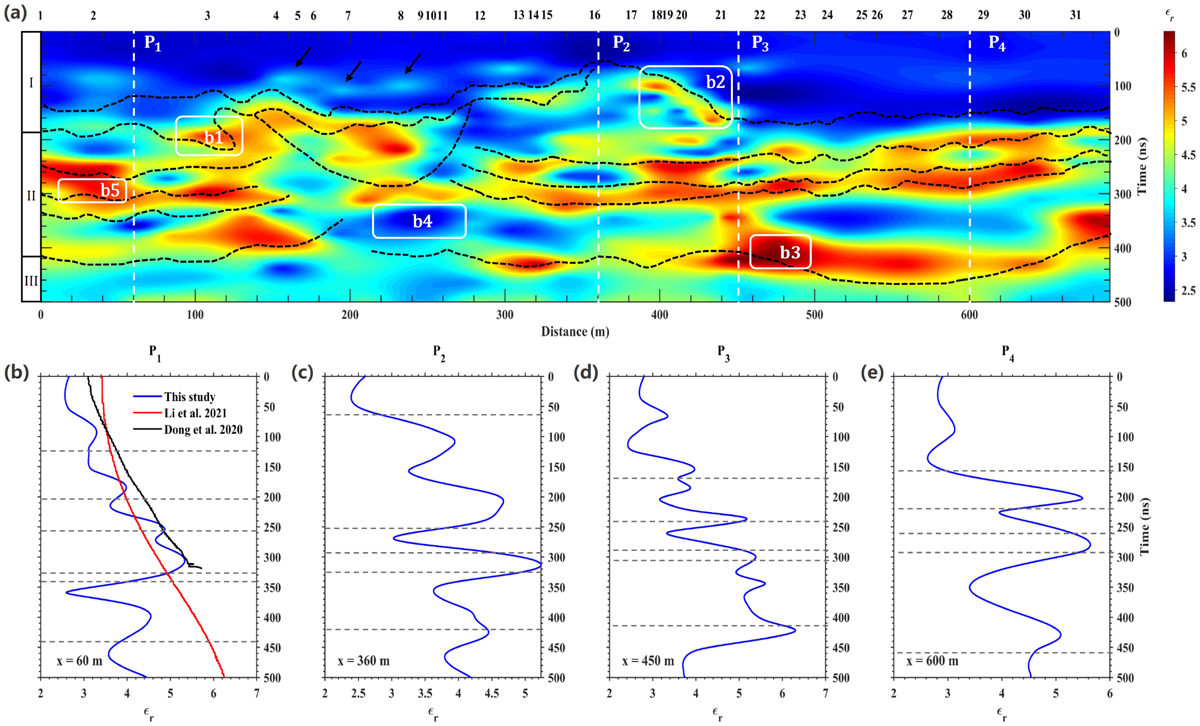
Permittivity distribution determined by the CH2 data during the first 31 lunar days. The colour bar represents the relative permittivity values. The sites of 31 lunar days are indicated by the numbers at the top of the panel. (a) Permittivity distribution calculated by our method, where black dashed lines depict the boundary of the reflectors, and white dashed lines P1–P4 show the positions of permittivity profiles of the four vertical distribution in b−e. b−e Detailed permittivity varying with depths at a single horizontal position, located at x = 60, 360, 450, and 600 m, respectively. The grey horizontal dashed lines in b−e are the time values of the intersections between the four profiles (P1–P4) and reflector boundaries shown in a. The comparison of permittivity with Dong et al. (2020b) and Li & Zhang (2021) at x = 60 m, as shown in b.
Current usage metrics show cumulative count of Article Views (full-text article views including HTML views, PDF and ePub downloads, according to the available data) and Abstracts Views on Vision4Press platform.
Data correspond to usage on the plateform after 2015. The current usage metrics is available 48-96 hours after online publication and is updated daily on week days.
Initial download of the metrics may take a while.