Free Access
Fig. 5
Download original image
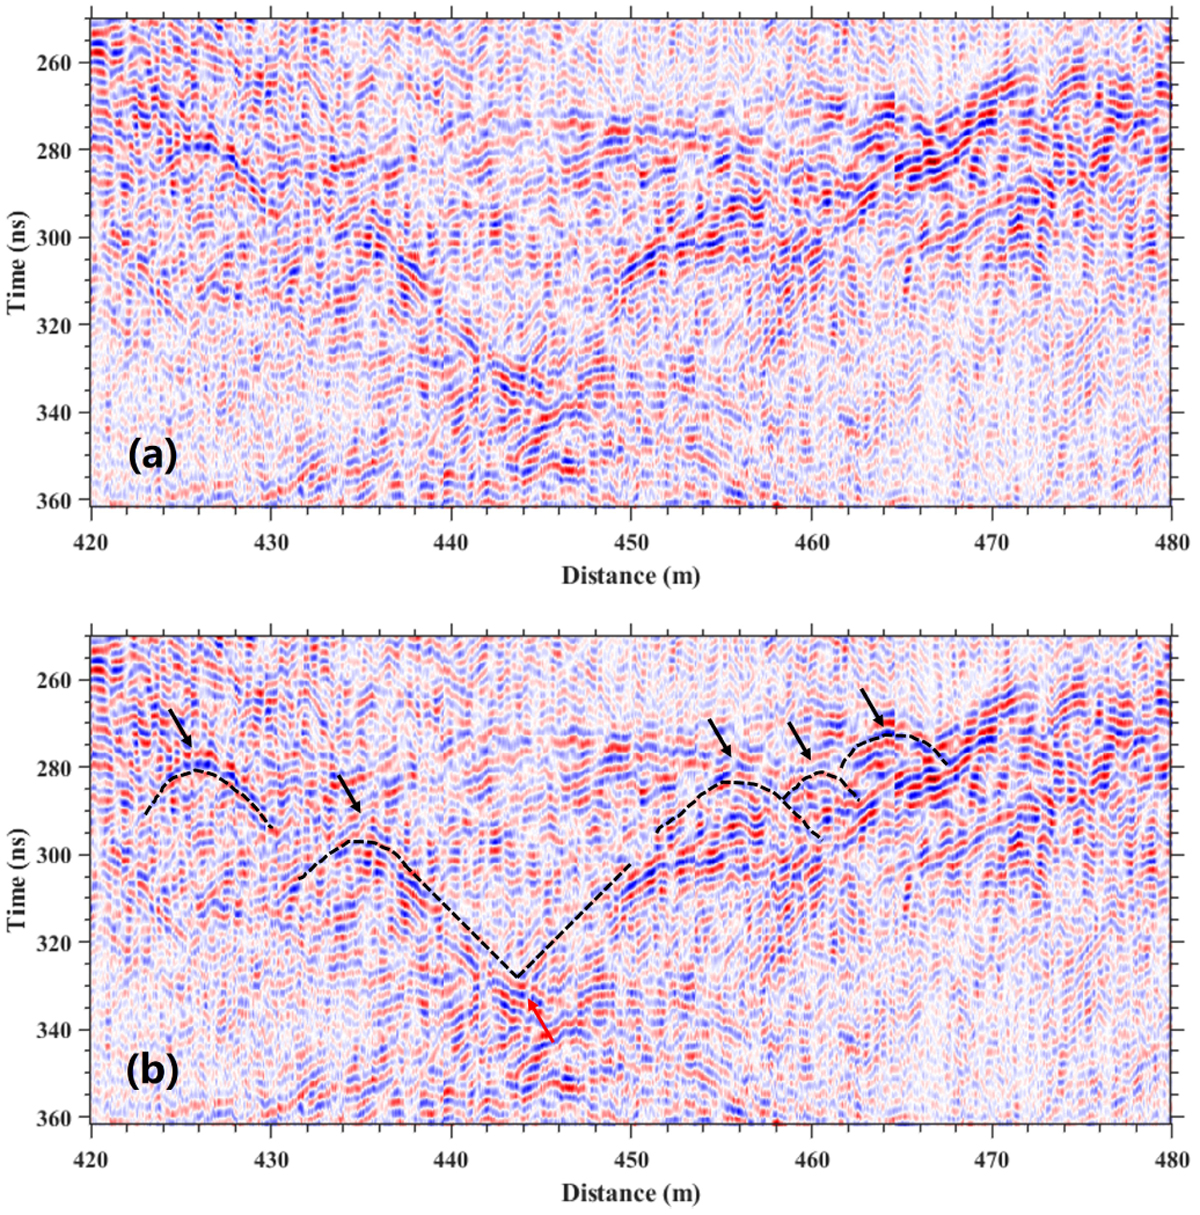
‘V’ structure at x ≈ 450 m. (a) Original radargram. (b) V structure and hyperbolas are depicted by dashed lines and arrows. The red arrow points to the bottom of the V structure.
Current usage metrics show cumulative count of Article Views (full-text article views including HTML views, PDF and ePub downloads, according to the available data) and Abstracts Views on Vision4Press platform.
Data correspond to usage on the plateform after 2015. The current usage metrics is available 48-96 hours after online publication and is updated daily on week days.
Initial download of the metrics may take a while.