Fig. 3
Download original image
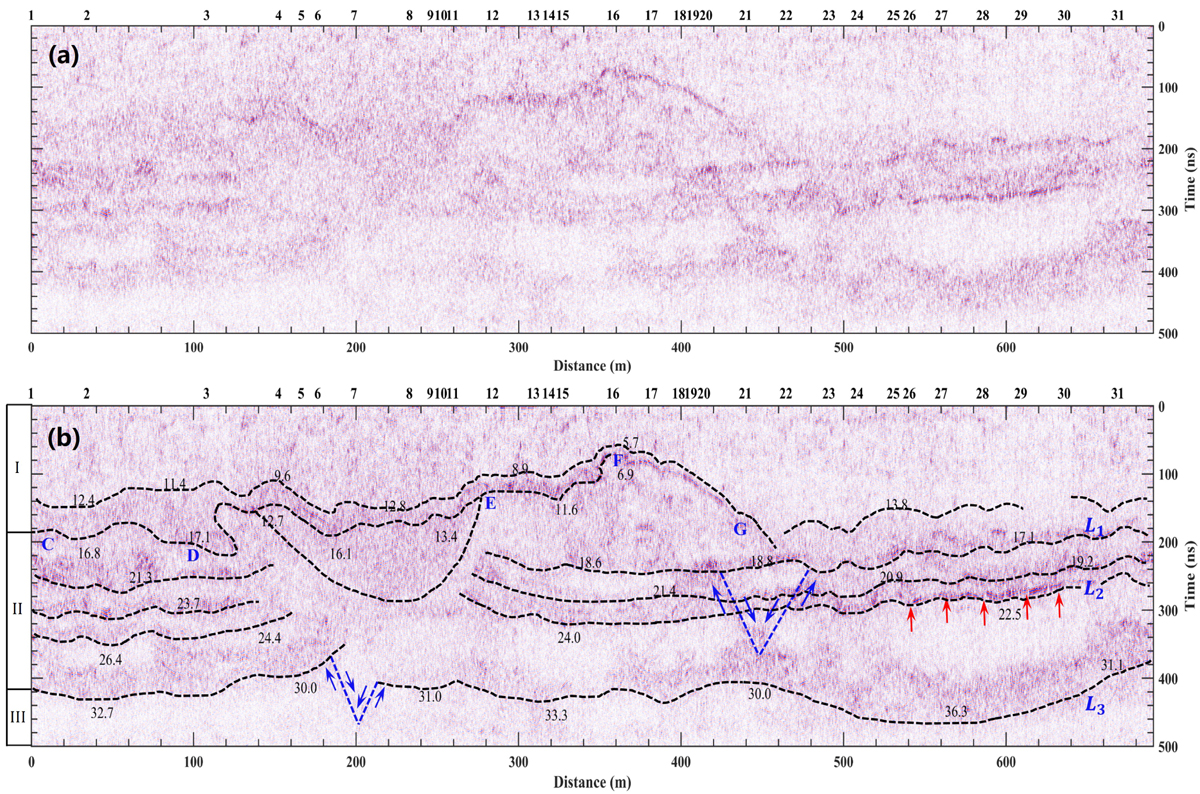
Shallow sub-surface structure imaged by CH2 data during the first 31 lunar days. The colour bar represents the amplitude of the radar signals. The sites of 31 lunar days are indicated by the numbers at the top of the panel. (a) High-frequency LPR profile. (b) Interpreted stratification structure. Black dashed lines mark the boundary of the reflectors. The blue dashed lines indicate the fault plane, and the blue arrows represent the relative movement direction of the current layer. Black numbers represent the depth in metres varying with positions. On the left side of the figure, we show the division of the radar sub-surface structures: I, II, and III.
Current usage metrics show cumulative count of Article Views (full-text article views including HTML views, PDF and ePub downloads, according to the available data) and Abstracts Views on Vision4Press platform.
Data correspond to usage on the plateform after 2015. The current usage metrics is available 48-96 hours after online publication and is updated daily on week days.
Initial download of the metrics may take a while.