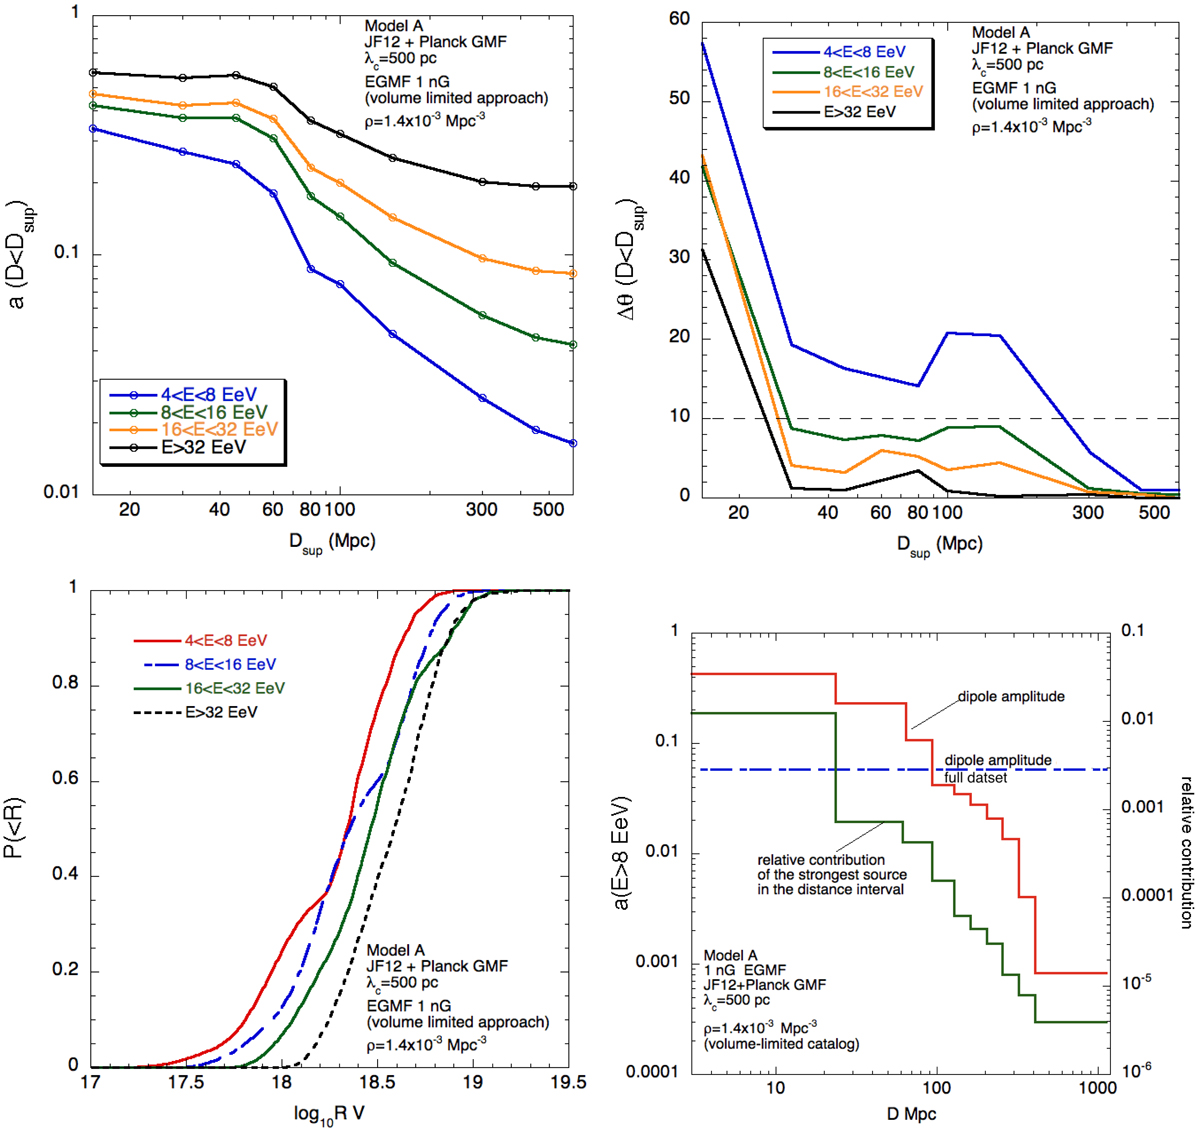
Fig. 22.
Download original image
Contribution of various source distances and UHECR rigidities to the observed dipole. Top-left: evolution of the dipole amplitude with the distance Dsup (see text) for different energy bins. Top-right: evolution of the angular distance between the dipole direction reconstructed considering only cosmic-rays originating from sources within a distance Dsup and that reconstructed for the full dataset as a function of Dsup, for different energy bins. Bottom-left: cumulative distribution of the UHECR rigidities in different energy bins. Bottom-right: amplitude of the dipole reconstructed in ten distance intervals each accounting for ∼10% of the total flux in the E ≥ 8 EeV energy bin. These amplitudes can be compared to that obtained for the full dataset (shown by a dashed-dotted line). The fractional contribution of the strongest source to the total flux in each distance interval is also shown. In all the panels, the astrophysical scenario considered is the baseline volume-limited catalog, source model A, a 1 nG EGMF, the JF12+Planck model with λc = 500 pc and the statistics is cumulated over 300 Auger datasets.
Current usage metrics show cumulative count of Article Views (full-text article views including HTML views, PDF and ePub downloads, according to the available data) and Abstracts Views on Vision4Press platform.
Data correspond to usage on the plateform after 2015. The current usage metrics is available 48-96 hours after online publication and is updated daily on week days.
Initial download of the metrics may take a while.