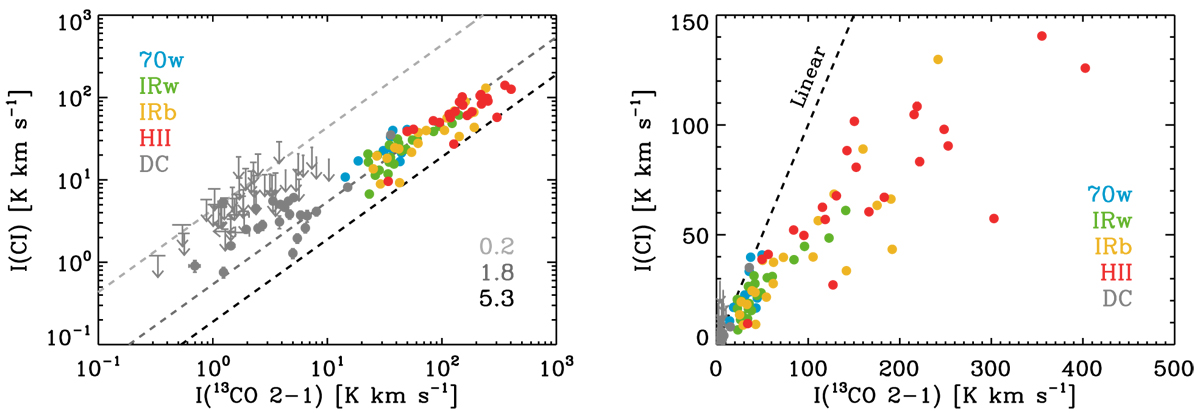
Fig. 5
Download original image
Comparison between the [C I] 492 GHz and 13CO(21) integrated intensities. All three types (Types 0, 1, and 2; Sect. 4.1.1) are used here, and the 70w, IRw, IRb, H II region groups, and diffuse cloud components are shown in different colors. For the Type 1, upper limits were calculated by N.C([C I]) [C I] 492 GHz 5− −v([C I]) where N.C([C I]) is the number of [C I] channels over which 13CO is detected and −v([C I]) is the velocity resolution of the [C I] spectra. A similar calculation was done for the Type 2, but using the number of 13CO channels over which [C I] is detected, 13CO 5−, and velocity resolution of the 13CO spectra instead. These derived upper limits are indicated as the arrows. Left: log scale. The measured minimum, median, and maxium I(13CO)-to-I([C I]) ratios (0.2, 1.8, and 5.3) are indicated as the dashed lines in different shades of gray color. Right: linear scale. A linear one-to-one relation is shown as the black dashed line.
Current usage metrics show cumulative count of Article Views (full-text article views including HTML views, PDF and ePub downloads, according to the available data) and Abstracts Views on Vision4Press platform.
Data correspond to usage on the plateform after 2015. The current usage metrics is available 48-96 hours after online publication and is updated daily on week days.
Initial download of the metrics may take a while.