Fig. 4
Download original image
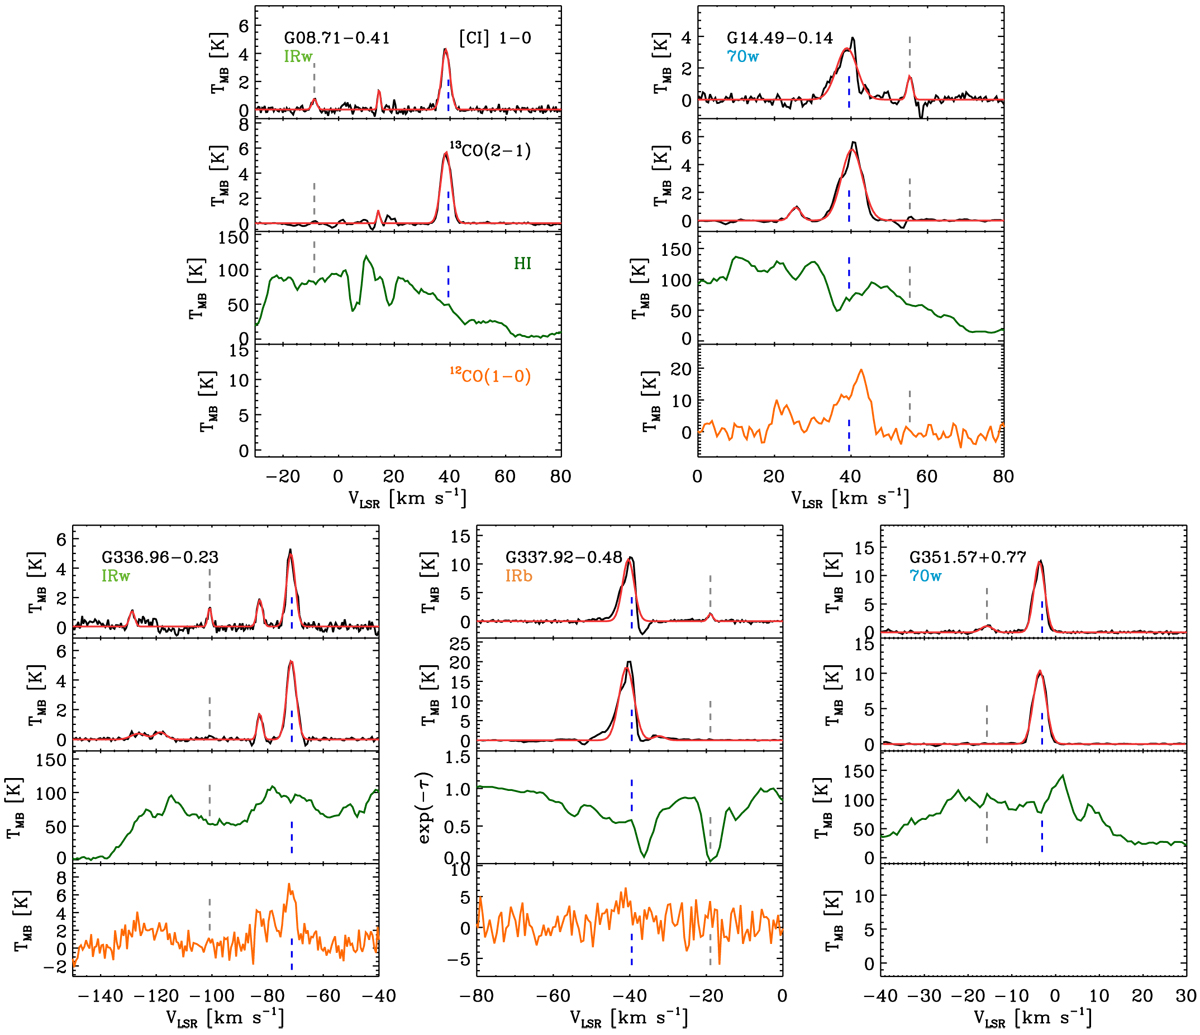
Comparison between [C I] 492 GHz (black), 13CO(21) (black), H I (green), and 12CO(10) (orange) for five sources. For H I, the absorption spectrum from Brown et al. (2014) is shown for G337.920.48, while SGPS data are presented for the remaining sources. In addition, 12CO(10) spectra from the FUGIN (G14.490.14) and Mopra (G336.960.23 and G337.920.48) surveys are used. Over the [C I] 492 GHz and 13CO(21) spectra, the fitted Gaussians are overlaid in red. Finally, the source velocities and the secondary components that are seen in [C I] 492 GHz without corresponding 13CO(21) detections are indicated in blue and gray respectively.
Current usage metrics show cumulative count of Article Views (full-text article views including HTML views, PDF and ePub downloads, according to the available data) and Abstracts Views on Vision4Press platform.
Data correspond to usage on the plateform after 2015. The current usage metrics is available 48-96 hours after online publication and is updated daily on week days.
Initial download of the metrics may take a while.