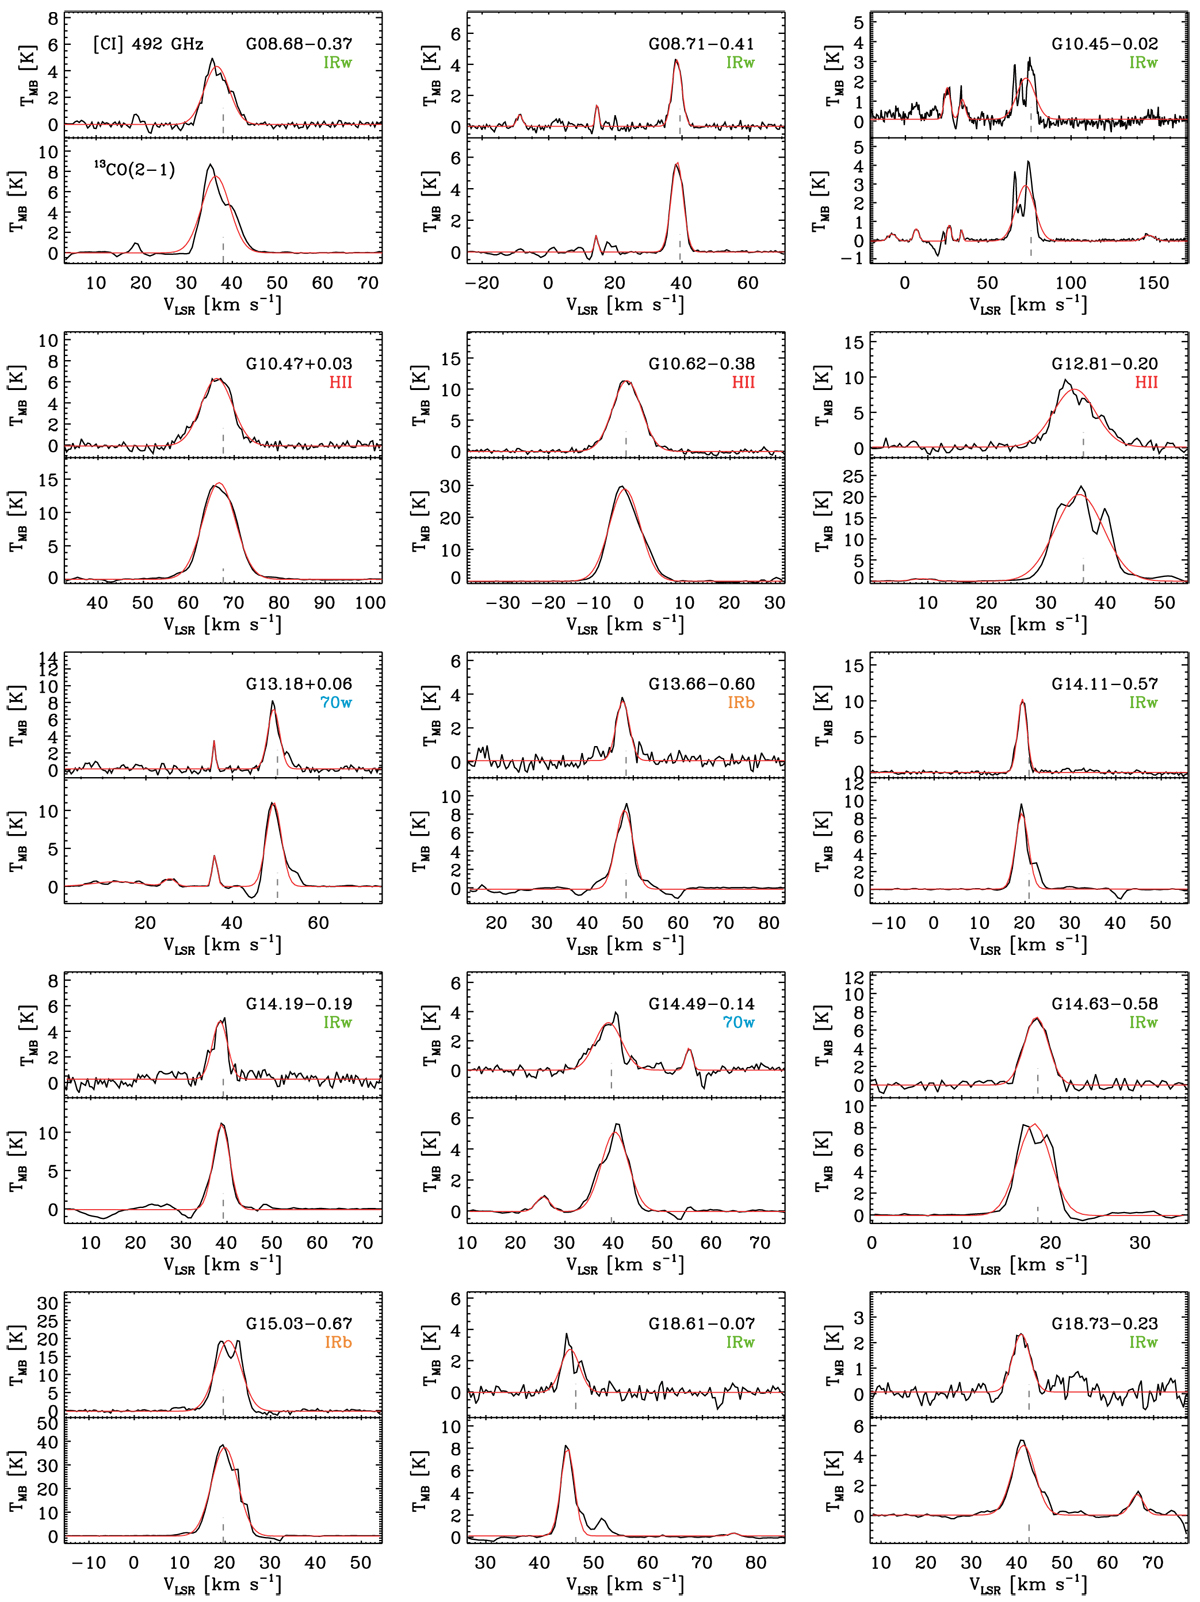
Fig. B.1
Download original image
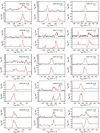
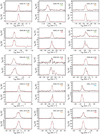
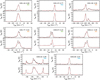
APEX [C I] 492 GHz and 13CO(2−1) spectra (top and bottom for each panel). The fitted Gaussians are overlaid in red, and the source velocities are indicated as the gray dashed lines. Several spectra (in particular 13CO(2−1)) show absorption features, which most likely result from contaminated reference positions. On the other hand, [C I]-absorbing components toward G43.17+0.01 and G330.95−0.18 are labelled with the word “ABS”.
Current usage metrics show cumulative count of Article Views (full-text article views including HTML views, PDF and ePub downloads, according to the available data) and Abstracts Views on Vision4Press platform.
Data correspond to usage on the plateform after 2015. The current usage metrics is available 48-96 hours after online publication and is updated daily on week days.
Initial download of the metrics may take a while.