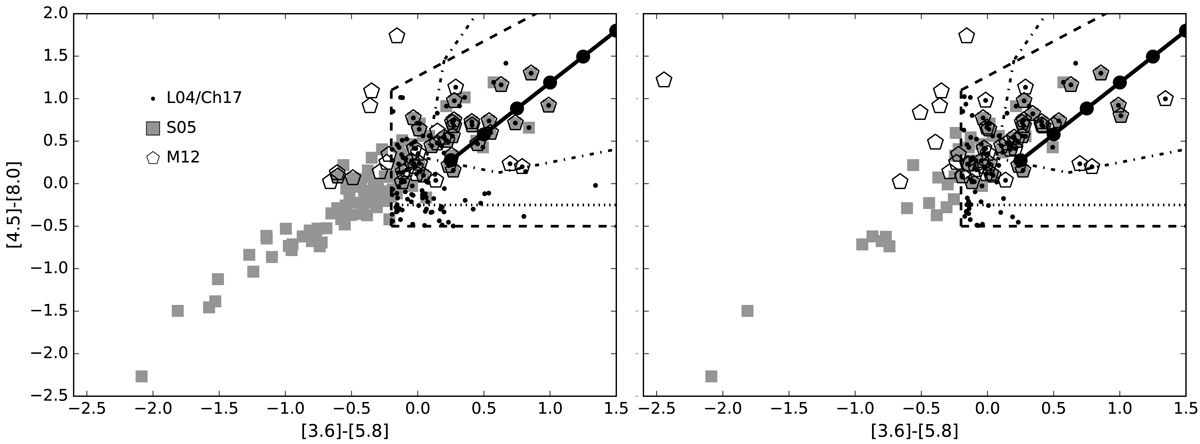
Fig. 9.
Download original image
Mid-IR ([4.5]−[8.0] vs. [3.6]−[5.8]) colour–colour diagrams for AGNs selected according the methods present by L04 and Ch17 (small dots). We also included the AGN colours using the methods present by S05 (squares) and M12 (pentagons). The region marked with dashed and dot-dashed lines show the selection criteria of L04 and Ch17, respectively. Horizontal dotted lines shows a correction of +0.25 magnitudes proposed by Lacy et al. (2007). The line with filled black circles indicates the locus of sources whose spectrum can be described as a power law with α = −0.5 (lower left) to α = −3.0 (upper right).
Current usage metrics show cumulative count of Article Views (full-text article views including HTML views, PDF and ePub downloads, according to the available data) and Abstracts Views on Vision4Press platform.
Data correspond to usage on the plateform after 2015. The current usage metrics is available 48-96 hours after online publication and is updated daily on week days.
Initial download of the metrics may take a while.