Fig. 8.
Download original image
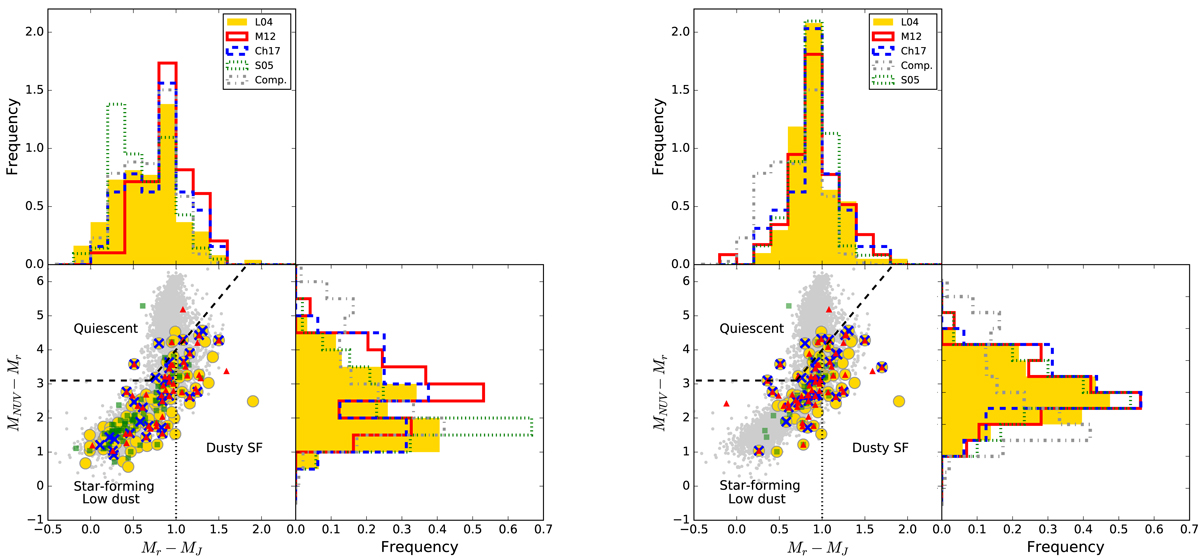
Rest-frame (MNUV − Mr) vs. (Mr − MJ) colour–colour diagram for AGN host galaxies selected according to the KEx (left panel) and the MEx (right panel) line diagnostic methods. Dashed lines mark regions that separate quiescent (upper left corner) and star-forming galaxies. The symbols are the same as in Fig. 7. The zCOSMOS non-AGN sample, a comparison sample of galaxies with a similar mass distribution at 0.3 ≤ zsp ≤ 0.9, is represented by grey points. Colour distributions are included in the upper and right panels. The comparison sample is represented by dotted grey circles.
Current usage metrics show cumulative count of Article Views (full-text article views including HTML views, PDF and ePub downloads, according to the available data) and Abstracts Views on Vision4Press platform.
Data correspond to usage on the plateform after 2015. The current usage metrics is available 48-96 hours after online publication and is updated daily on week days.
Initial download of the metrics may take a while.