Fig. 7.
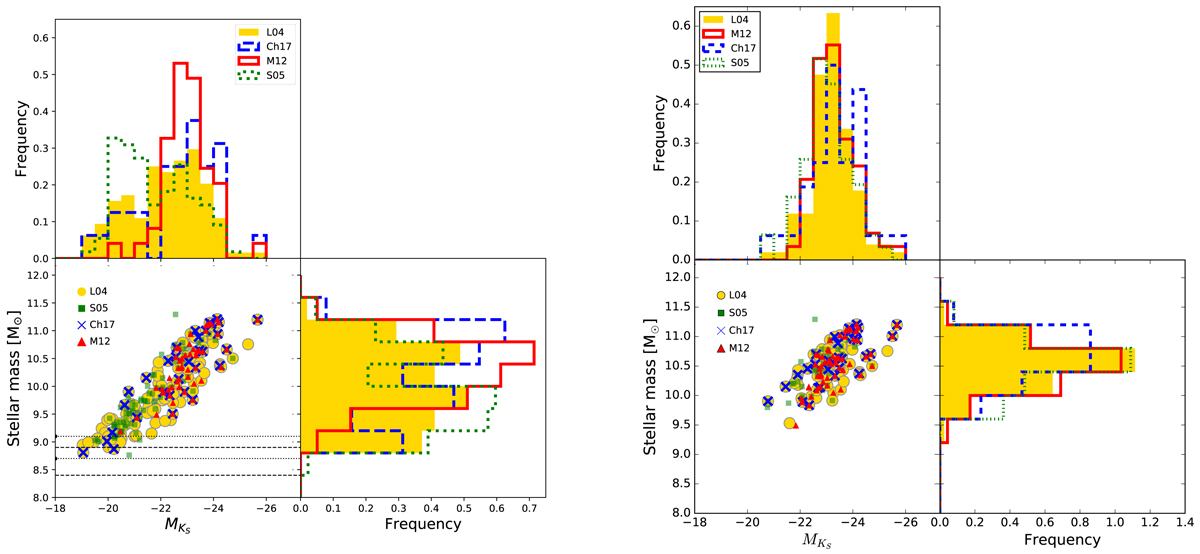
Download original image
AGN host stellar mass vs. absolute Ks-band magnitude using the KEx (left panel) and the MEx (right panel) line diagnostic methods. The horizontal dashed line shows the stellar mass completeness obtained by Laigle et al. (2016) for the regions called 𝒜Deep (dotted lines) and 𝒜UD in the redshift range 0.35 < z < 0.65 and 0.65 < z < 0.95, respectively. The upper and right panels in each figure show the absolute Ks band and the stellar mass distributions for each sample. Circles, squares, crosses, and triangles represent pre-selected AGNs according to the methods of S05, L04, Ch17, and M12, respectively.
Current usage metrics show cumulative count of Article Views (full-text article views including HTML views, PDF and ePub downloads, according to the available data) and Abstracts Views on Vision4Press platform.
Data correspond to usage on the plateform after 2015. The current usage metrics is available 48-96 hours after online publication and is updated daily on week days.
Initial download of the metrics may take a while.