Fig. 4.
Download original image
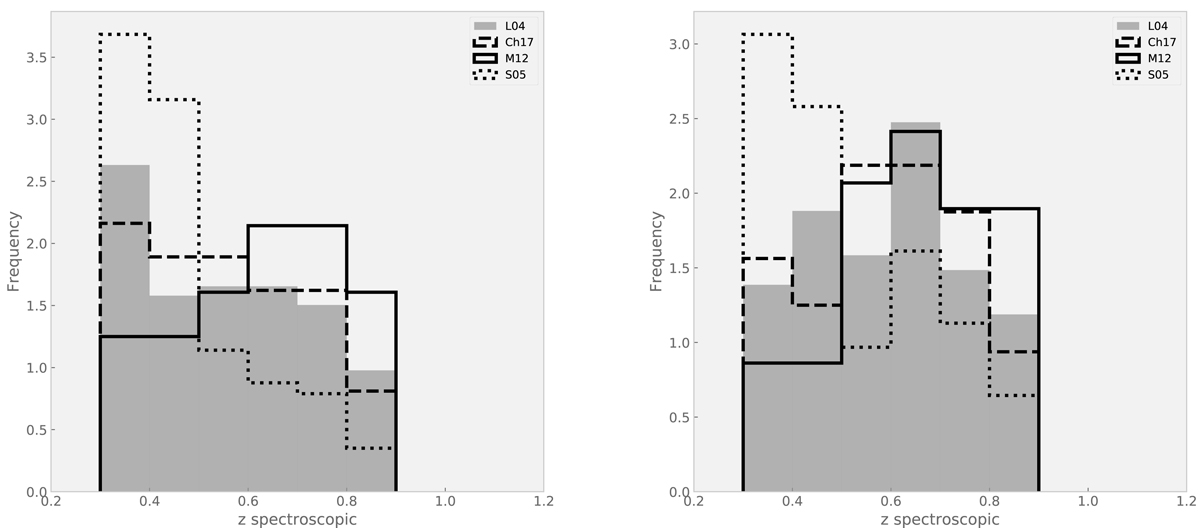
Spectroscopic redshift distribution for AGNs selected according the different MIR and near-IR methods using the KEx (left panel) and MEx (right panel) diagrams. Dotted and shaded histograms represent the distributions using the methods proposed by S05 and L04, and solid and dashed line histograms show the methods proposed by M12 and Ch17, respectively.
Current usage metrics show cumulative count of Article Views (full-text article views including HTML views, PDF and ePub downloads, according to the available data) and Abstracts Views on Vision4Press platform.
Data correspond to usage on the plateform after 2015. The current usage metrics is available 48-96 hours after online publication and is updated daily on week days.
Initial download of the metrics may take a while.