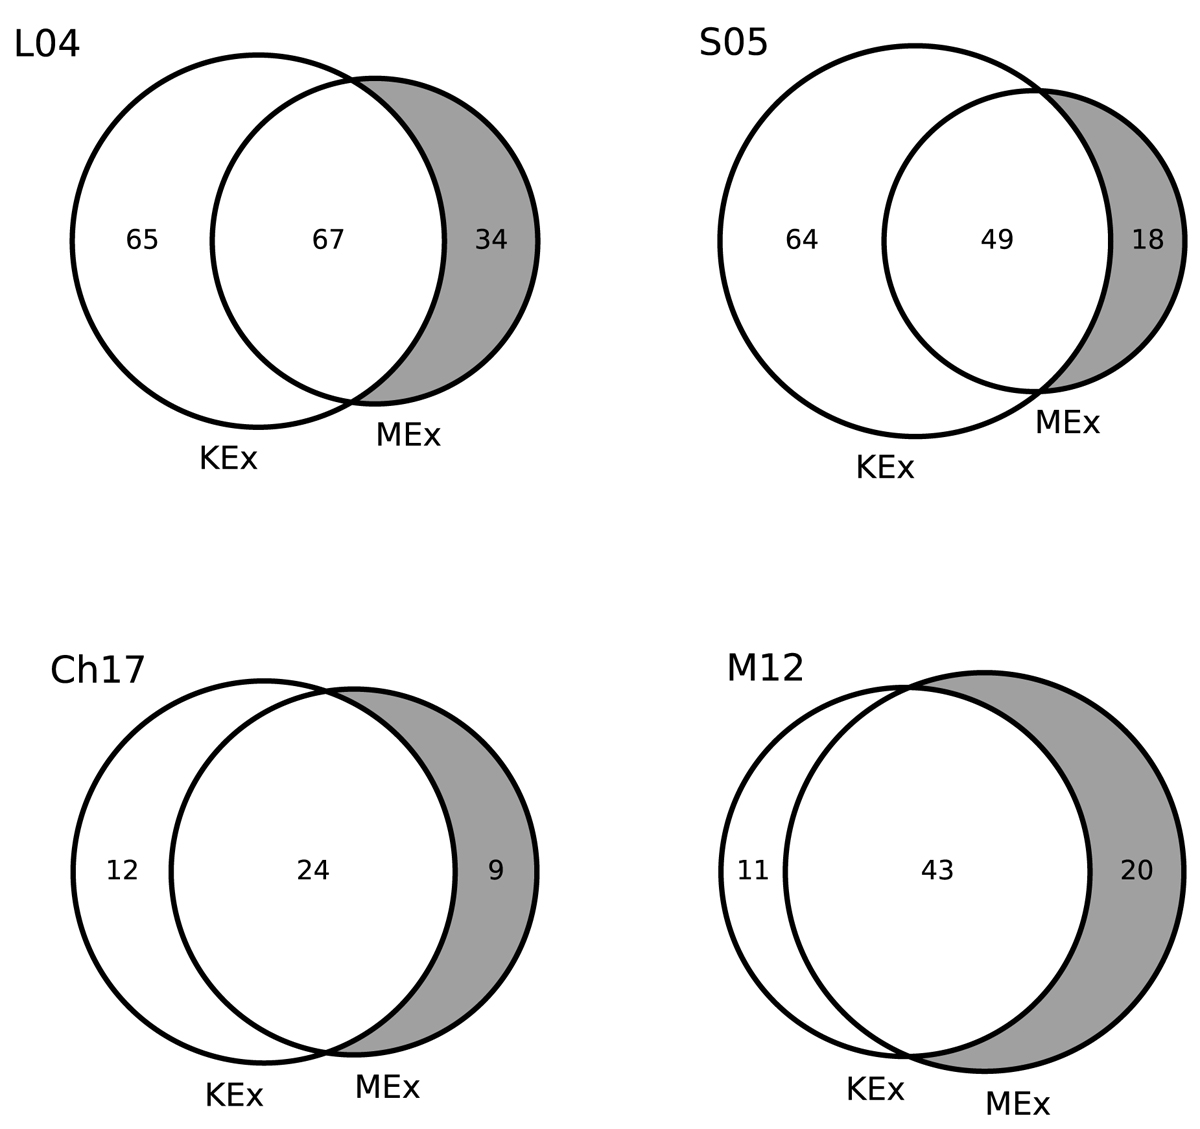
Fig. 3.
Download original image
Venn diagrams showing the number and overlap for pre-selected AGNs according to the L04, S05, Ch17, and M12 methods and also selected using the KEx and MEx diagrams. The area and overlap of each circle are proportional to the total number of each sample. Areas that represent AGNs that were only identified according to the MEx diagram are shown in grey.
Current usage metrics show cumulative count of Article Views (full-text article views including HTML views, PDF and ePub downloads, according to the available data) and Abstracts Views on Vision4Press platform.
Data correspond to usage on the plateform after 2015. The current usage metrics is available 48-96 hours after online publication and is updated daily on week days.
Initial download of the metrics may take a while.