Fig. 2.
Download original image
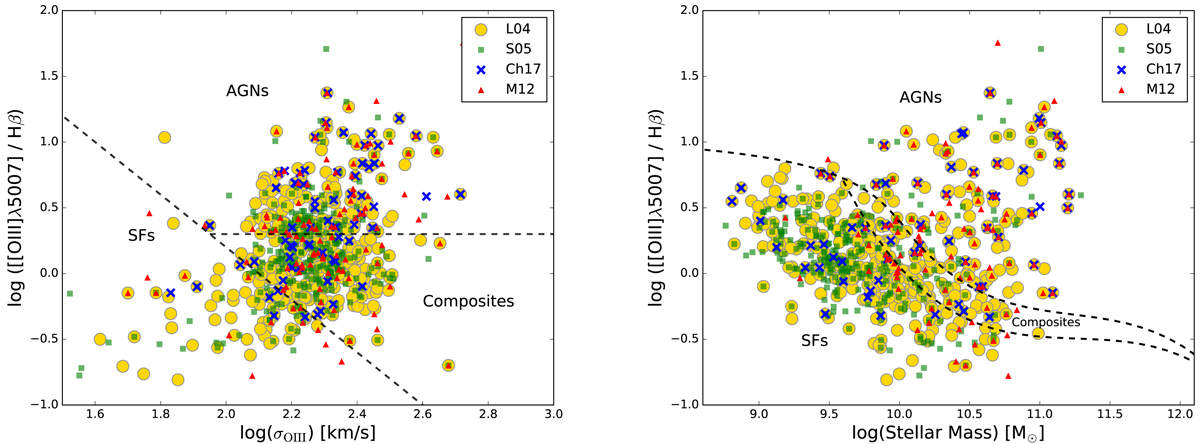
Emission line diagnostic diagrams. Left panel: KEx and the right panel the MEx diagram. The circles, squares, crosses, and triangles represent pre-selected AGNs according to the methods of L04, S05, Ch17, and M12, respectively. The regions in both diagrams that are marked with dashed lines show the location of AGNs, composites, and star-forming galaxies.
Current usage metrics show cumulative count of Article Views (full-text article views including HTML views, PDF and ePub downloads, according to the available data) and Abstracts Views on Vision4Press platform.
Data correspond to usage on the plateform after 2015. The current usage metrics is available 48-96 hours after online publication and is updated daily on week days.
Initial download of the metrics may take a while.