Fig. 14.
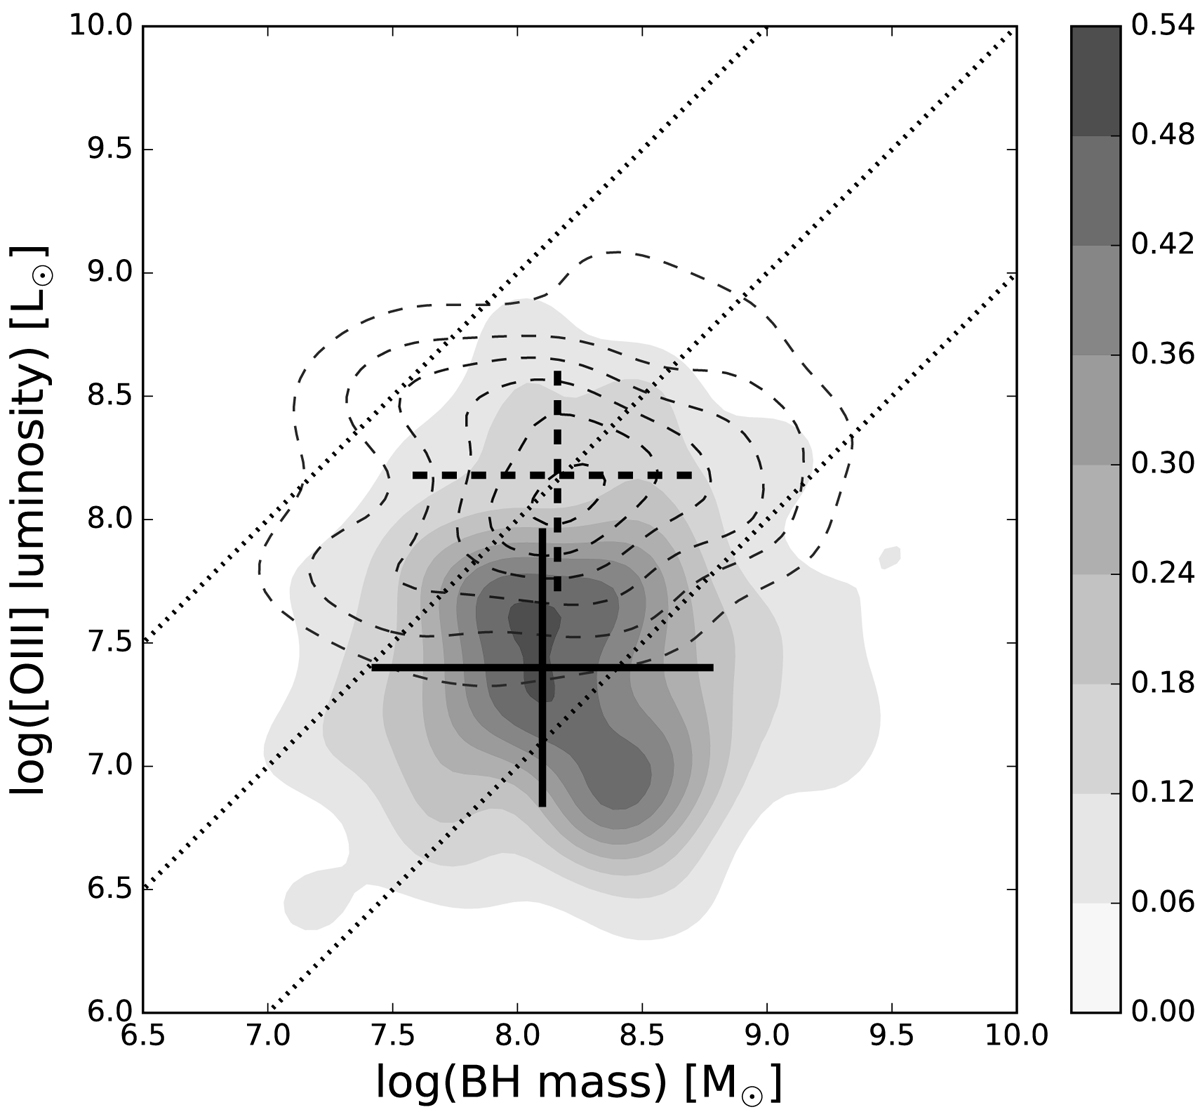
Download original image
OIII λ5007 luminosity vs. black hole mass for AGNs selected according to the MIR and near-IR methods using the MEx line diagnostic diagrams (grey contours). Dashed line contours represent the corresponding values for highly accreting QSOs. Point lines from upper to lower right indicate ∼100%, ∼10%, and ∼1% of the Eddington limit, respectively, assuming bolometric correction 3500 for OIII luminosity (Heckman et al. 2004; Choi et al. 2009). Solid and dashed line bars represent the mean and 1σ values for our sample of AGNs and for the sample of highly accreting QSOs, respectively.
Current usage metrics show cumulative count of Article Views (full-text article views including HTML views, PDF and ePub downloads, according to the available data) and Abstracts Views on Vision4Press platform.
Data correspond to usage on the plateform after 2015. The current usage metrics is available 48-96 hours after online publication and is updated daily on week days.
Initial download of the metrics may take a while.