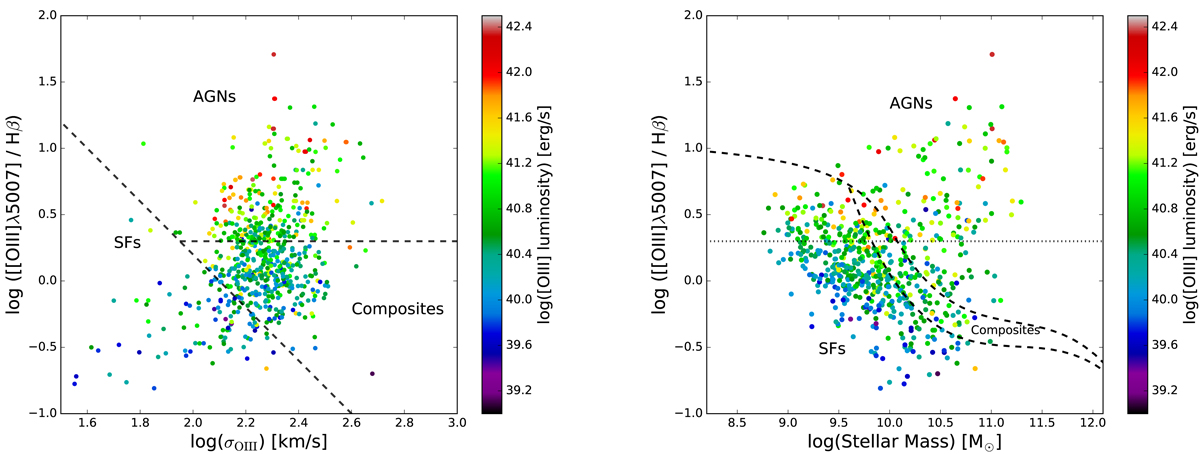
Fig. 10.
Download original image
Kinematics (left panel) and mass-excitation (right panel) diagrams for sources selected according to MIR and near-IR methods proposed by S05, L04, Ch17, and M12. The vertical bar represents the [O III] λ5007 luminosity of each source. The horizontal dotted line in the right panel shows the limit at y = 0.3 that separate AGNs in the KEx diagram.
Current usage metrics show cumulative count of Article Views (full-text article views including HTML views, PDF and ePub downloads, according to the available data) and Abstracts Views on Vision4Press platform.
Data correspond to usage on the plateform after 2015. The current usage metrics is available 48-96 hours after online publication and is updated daily on week days.
Initial download of the metrics may take a while.