Fig. 1.
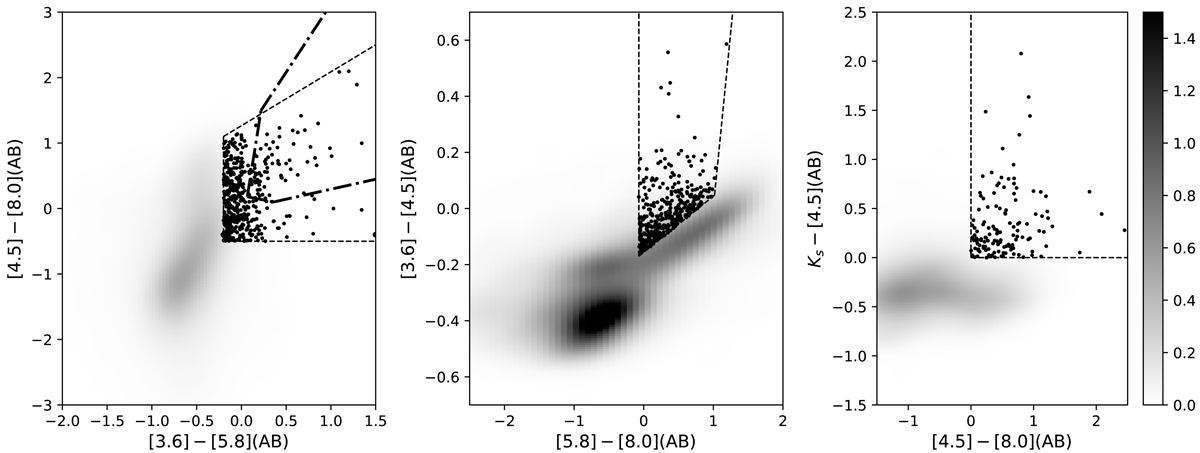
Download original image
MIR and near-IR colour–colour diagrams and the selection of AGNs for different photometric methods. The left panel shows the criteria of Lacy et al. (2004) (dotted lines) and Chang et al. (2017) (dashed-point lines). The middle panel shows the criterion of Stern et al. (2005), and the right panel shows the criterion of Messias et al. (2012). In each panel we show the 2D density maps that represent galaxies with spectroscopic redshifts with confidence classes 3 and 4 taken from the zCOSMOS DR3 survey. The pre-selected AGNs are represented with black circles.
Current usage metrics show cumulative count of Article Views (full-text article views including HTML views, PDF and ePub downloads, according to the available data) and Abstracts Views on Vision4Press platform.
Data correspond to usage on the plateform after 2015. The current usage metrics is available 48-96 hours after online publication and is updated daily on week days.
Initial download of the metrics may take a while.