Fig. 9.
Download original image
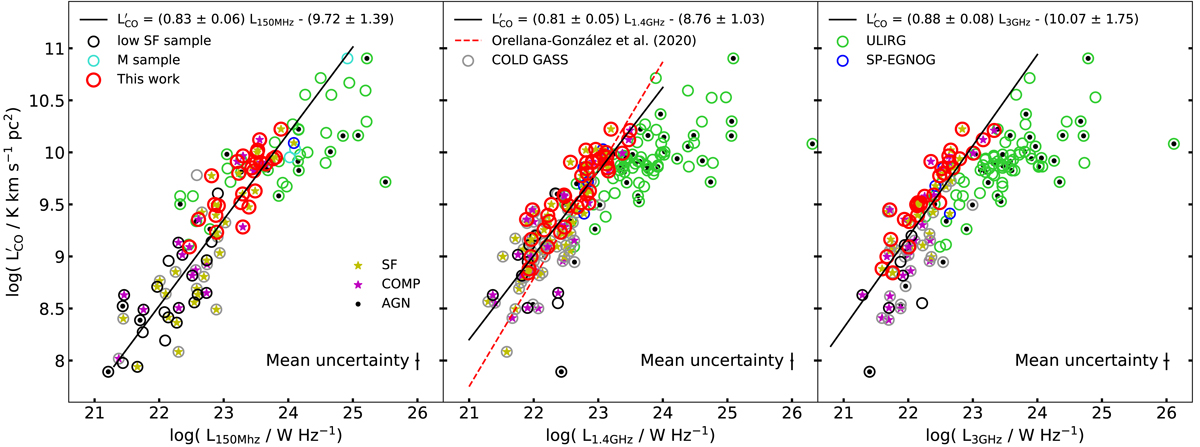
Correlation between ![]() and radio luminosity at 150 MHz (left panel), 1.4 GHz (middle panel) and 3 GHz (right panel). We show k-corrected radio luminosity following Eq. (1). Circles show the DP (red), EGNOG (blue), ULIRG (green), low-SF (black), COLD GASS (grey), and M samples (turquoise). We mark galaxies that are classified as AGN with a black dot in the centre and use a yellow (resp. purple) star to highlight galaxies classified as SF (resp. COMP). Middle panel: best fit for nearby galaxies found by Orellana-González et al. (2020) with a red dashed line. We fit a straight line in all three relations to all galaxies classified as SF or COMP and display the best fit with a solid black line. In each panel, we show the average uncertainties in the lower right corner with error bars.
and radio luminosity at 150 MHz (left panel), 1.4 GHz (middle panel) and 3 GHz (right panel). We show k-corrected radio luminosity following Eq. (1). Circles show the DP (red), EGNOG (blue), ULIRG (green), low-SF (black), COLD GASS (grey), and M samples (turquoise). We mark galaxies that are classified as AGN with a black dot in the centre and use a yellow (resp. purple) star to highlight galaxies classified as SF (resp. COMP). Middle panel: best fit for nearby galaxies found by Orellana-González et al. (2020) with a red dashed line. We fit a straight line in all three relations to all galaxies classified as SF or COMP and display the best fit with a solid black line. In each panel, we show the average uncertainties in the lower right corner with error bars.
Current usage metrics show cumulative count of Article Views (full-text article views including HTML views, PDF and ePub downloads, according to the available data) and Abstracts Views on Vision4Press platform.
Data correspond to usage on the plateform after 2015. The current usage metrics is available 48-96 hours after online publication and is updated daily on week days.
Initial download of the metrics may take a while.