Fig. 8.
Download original image
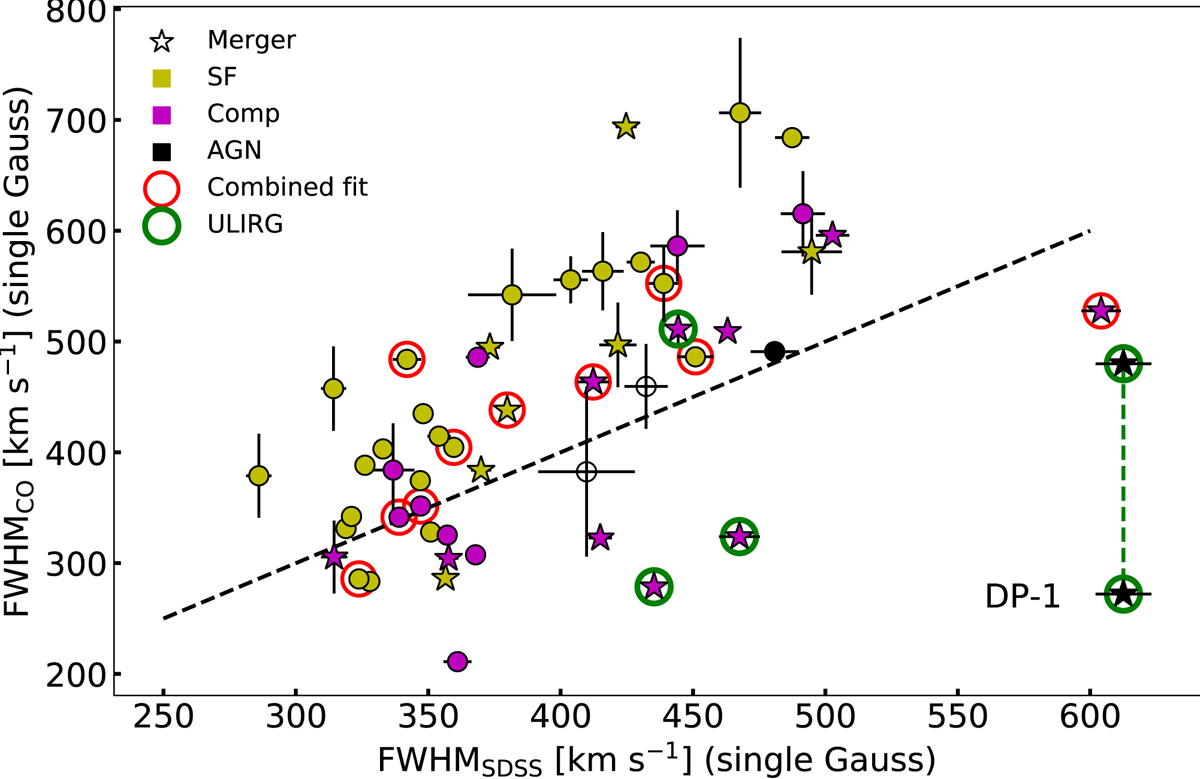
Comparison of FWHMs of ionised- and molecular-gas emission lines, estimated from a single-Gaussian function for the DP sample galaxies. The FWHMs of the ionised-gas emission lines (x-axis) measured inside the 3″ SDSS fibre are estimated by Chilingarian et al. (2017). The FWHMs of the CO line (x-axis) are measured as described in Sect. 3.3.3. The black dashed line denotes y = x. Error bars are estimated from the single-Gaussian line fitting. Stars indicate galaxies classified as mergers. The markers are coloured according to the BPT classification (see Sect. 3.3.1): SF in yellow, COMP in magenta and AGN in black. We mark galaxies for which we succeed in applying a combined line fit (see Sect. 3.1) by red circles. The four ULIRGs of the DP sample are marked with green circles. For the galaxy DP-1, the CO-FWHM is estimated both inside the 3″ SDSS fibre and for the entire galaxy, and the two points are connected with a green dashed line.
Current usage metrics show cumulative count of Article Views (full-text article views including HTML views, PDF and ePub downloads, according to the available data) and Abstracts Views on Vision4Press platform.
Data correspond to usage on the plateform after 2015. The current usage metrics is available 48-96 hours after online publication and is updated daily on week days.
Initial download of the metrics may take a while.