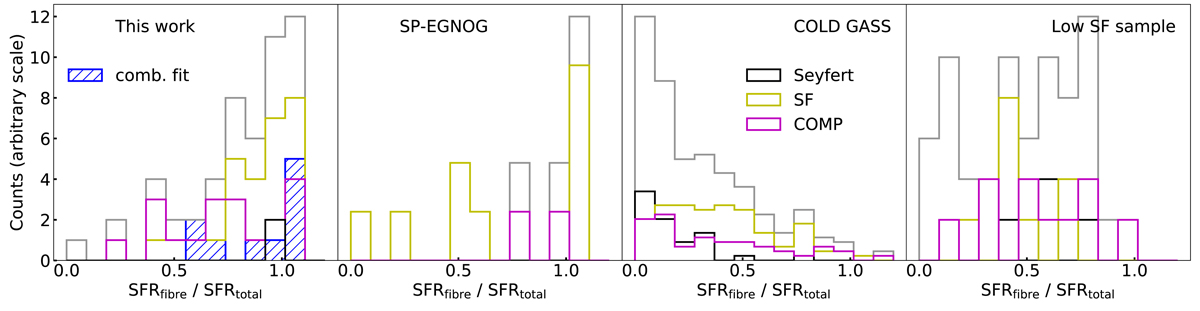
Fig. 7.
Download original image
Ratio of SFR inside the 3″ SDSS fibre SFRfibre and the total SFR SFRtotal (Brinchmann et al. 2004). We show this relation for galaxies processed by Brinchmann et al. (2004), which are, from left to right, the DP galaxies, 14 galaxies of the SP-EGNOG survey, 161 galaxies of the COLD GASS sample, and 74 galaxies of the low-SF sample. Subsets of BPT classification of SF are in yellow, those of COMP are in magenta, those of AGNs are in black, and those of the total histogram are in grey. For the DP sample, the subset of galaxies with successful combined fit is indicated with a hatched blue histogram. The scales of the histograms are in arbitrary units.
Current usage metrics show cumulative count of Article Views (full-text article views including HTML views, PDF and ePub downloads, according to the available data) and Abstracts Views on Vision4Press platform.
Data correspond to usage on the plateform after 2015. The current usage metrics is available 48-96 hours after online publication and is updated daily on week days.
Initial download of the metrics may take a while.