Fig. 6.
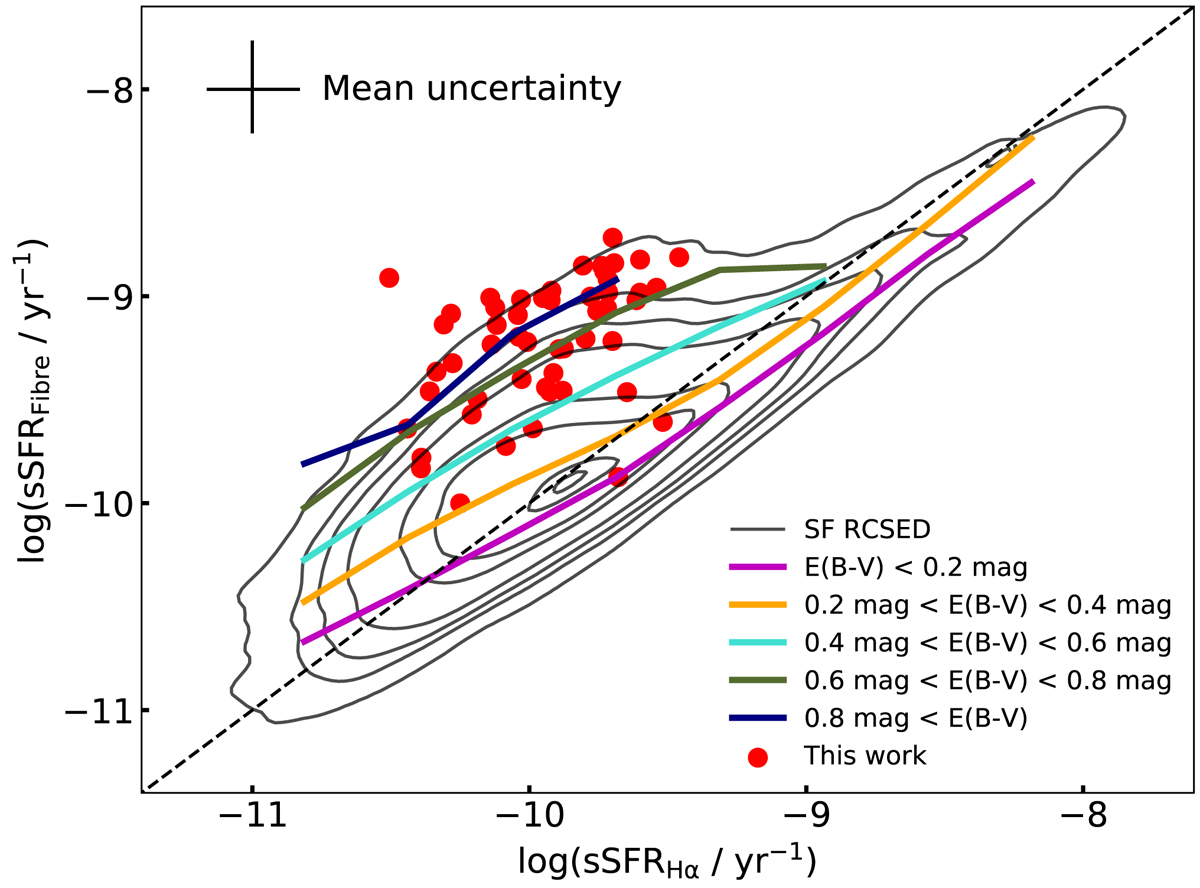
Download original image
Comparison of sSFR estimate inside the SDSS 3″ fibre. On the x-axis, we show the sSFR estimated from extinction corrected Hα luminosities (SFRHα), and on the y-axis, we show the sSFR inside the fibre (SFRfibre) estimated by Brinchmann et al. (2004). The DP sample is marked with red circles, and the galaxies with an S/N > 10 in the Hα line of the RCSED catalogue (Chilingarian et al. 2017) are marked with black contour lines. We also show the median of groups of different gas extinction E(B − V), computed following Eq. (11), with solid thick lines. The black dashed line denotes SFRHα = SFRfibre. The black error bar is the mean estimated uncertainty of the SFR, including stellar mass uncertainties.
Current usage metrics show cumulative count of Article Views (full-text article views including HTML views, PDF and ePub downloads, according to the available data) and Abstracts Views on Vision4Press platform.
Data correspond to usage on the plateform after 2015. The current usage metrics is available 48-96 hours after online publication and is updated daily on week days.
Initial download of the metrics may take a while.