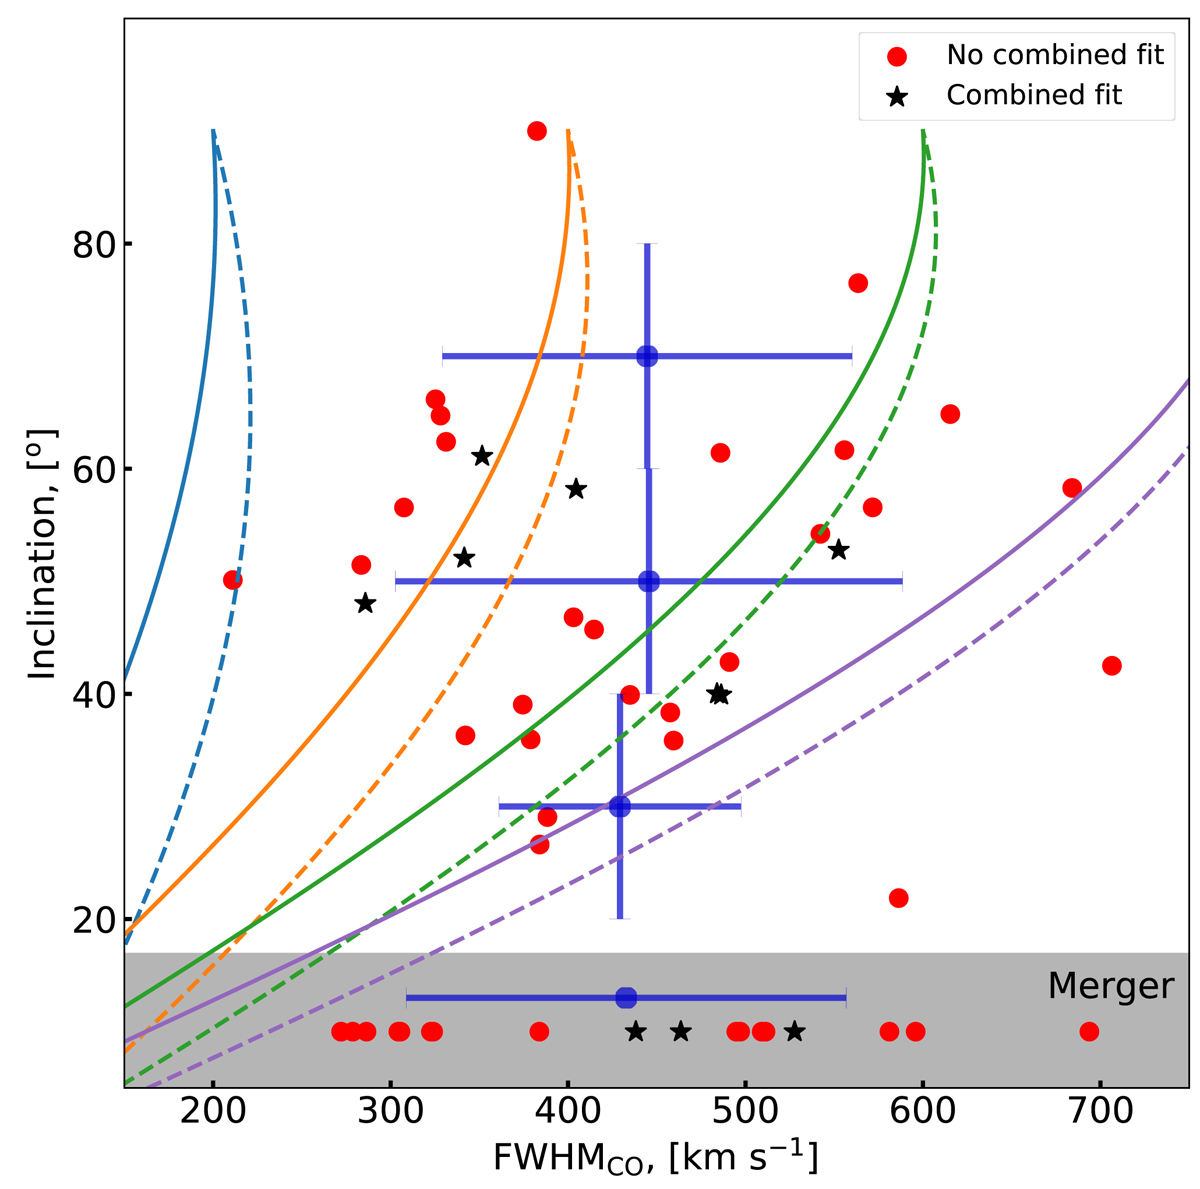
Fig. 5.
Download original image
Values of CO FWHM (x-axis) for different galaxy inclinations i (y-axis) of the DP sample. Black stars (resp. red dots) are galaxies for which we succeeded (resp. fail) in applying a combined line fit (see Sect. 3.1). Since it is not possible to measure the inclination of galaxy mergers, we show their FHWM values separately in the grey area at the bottom of the plot. Mean values of the FWHM and standard deviations are displayed with blue error bars for three groups of different inclinations and for the merger sub-sample. The curves show the relation between FWHM and inclination obtained for the estimate of Eq. (9) for a rotating disc, with vrot = 100, 200, 300, and 400 km s−1 for the blue, orange, green, and purple curves, respectively, and with gas velocity dispersions of 10 and 40 km s−1 for solid and dashed lines.
Current usage metrics show cumulative count of Article Views (full-text article views including HTML views, PDF and ePub downloads, according to the available data) and Abstracts Views on Vision4Press platform.
Data correspond to usage on the plateform after 2015. The current usage metrics is available 48-96 hours after online publication and is updated daily on week days.
Initial download of the metrics may take a while.