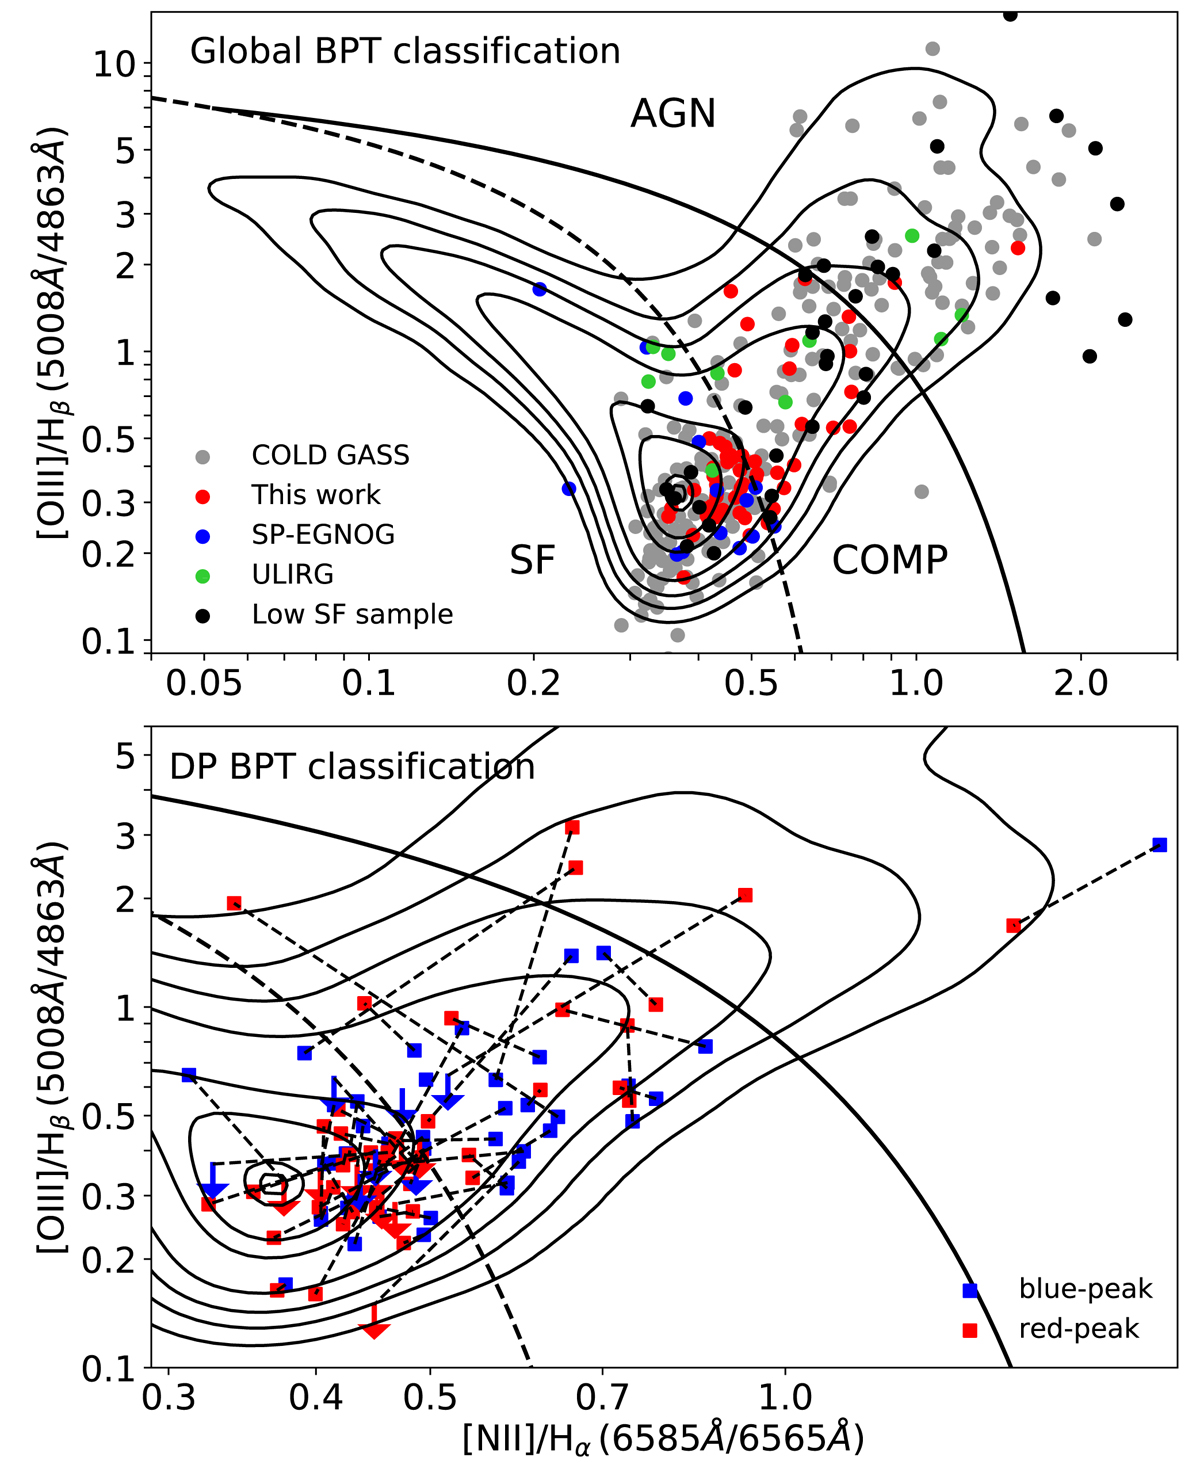
Fig. 4.
Download original image
BPT diagrams to classify our galaxy samples into different galaxy types based on ionised-gas emission-line ratios (Kewley et al. 2006). The black solid line separates AGN and COMP galaxies and the dashed black line star-forming galaxies from COMP galaxies. Top panel: galaxies of all samples with existing SDSS spectra. We use Gaussian or non-parametric emission-line fits, in case of a non-Gaussian emission-line shape, provided by Chilingarian et al. (2017). Bottom panel: for each galaxy of the DP sample, the blueshifted and redshifted peaks represented by blue and red squares, respectively, and connect them by a black dashed line. In comparison to the top panel, we zoomed into the region where we detect DP galaxies, to resolve both components. For galaxies with one of the needed emission lines below 3σ, we indicate the emission-line ratio limits with arrows. In both panels, we show contour lines representing galaxies of the RCSED catalogue which have a S/N > 3 in all required emission lines.
Current usage metrics show cumulative count of Article Views (full-text article views including HTML views, PDF and ePub downloads, according to the available data) and Abstracts Views on Vision4Press platform.
Data correspond to usage on the plateform after 2015. The current usage metrics is available 48-96 hours after online publication and is updated daily on week days.
Initial download of the metrics may take a while.