Fig. 3.
Download original image
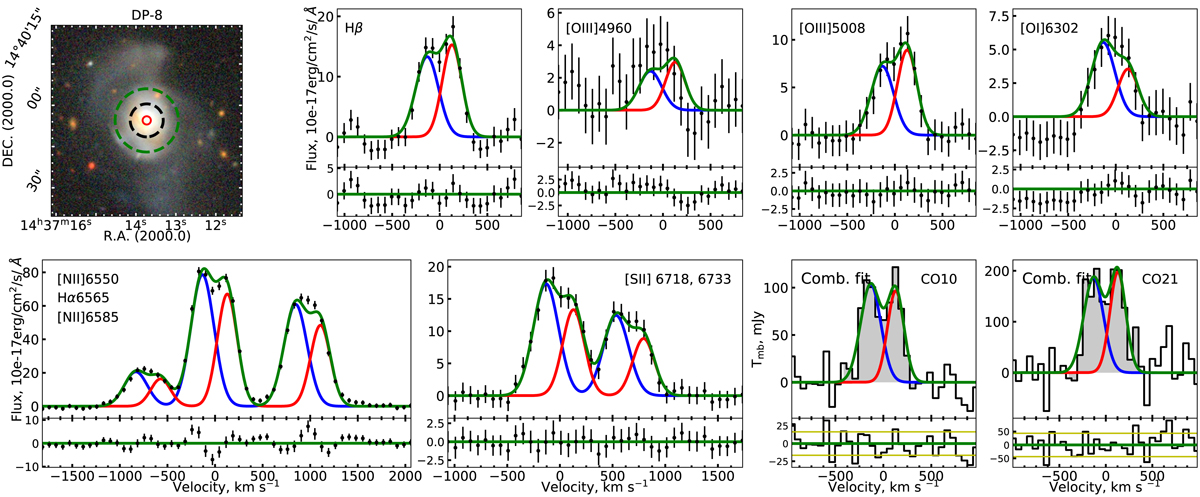
Example of combined emission-line fit for DP-8. We show the Legacy survey snapshot in the top left panel, with a red circle for the SDSS 3″ fibre and dashed green (resp. black) circles for the FWHM of the CO(1−0) (resp. CO(2−1)) beam of the IRAM 30 m telescope. The top row displays, next to the snapshot, the Hβ, [OIII]λ4960, [OIII]λ5008, and [OI]λ6302 emission lines. The bottom row displays the [NII]λ6550, Hα, [NII]λ6585, [SII]λ6718, and [SII]λ6733 emission lines, and two CO emission lines: CO(1−0) and CO(2−1). We show the double-Gaussian fit with the blueshifted (resp. redshifted) component in blue (resp. red) and the total fitted function in green. For each line, we show the residuals below. We display the rms level in yellow for the CO lines, estimated beside the lines. The x-axis measures the deviations from the velocity calculated using the redshift. For the Hα line and the [NII]λ6550, 6585 doublet, we display the lines with respect to the expected Hα line velocity, and, for the [SII]λ6718, 6733, with respect to the [SII]λ6718 line velocity.
Current usage metrics show cumulative count of Article Views (full-text article views including HTML views, PDF and ePub downloads, according to the available data) and Abstracts Views on Vision4Press platform.
Data correspond to usage on the plateform after 2015. The current usage metrics is available 48-96 hours after online publication and is updated daily on week days.
Initial download of the metrics may take a while.