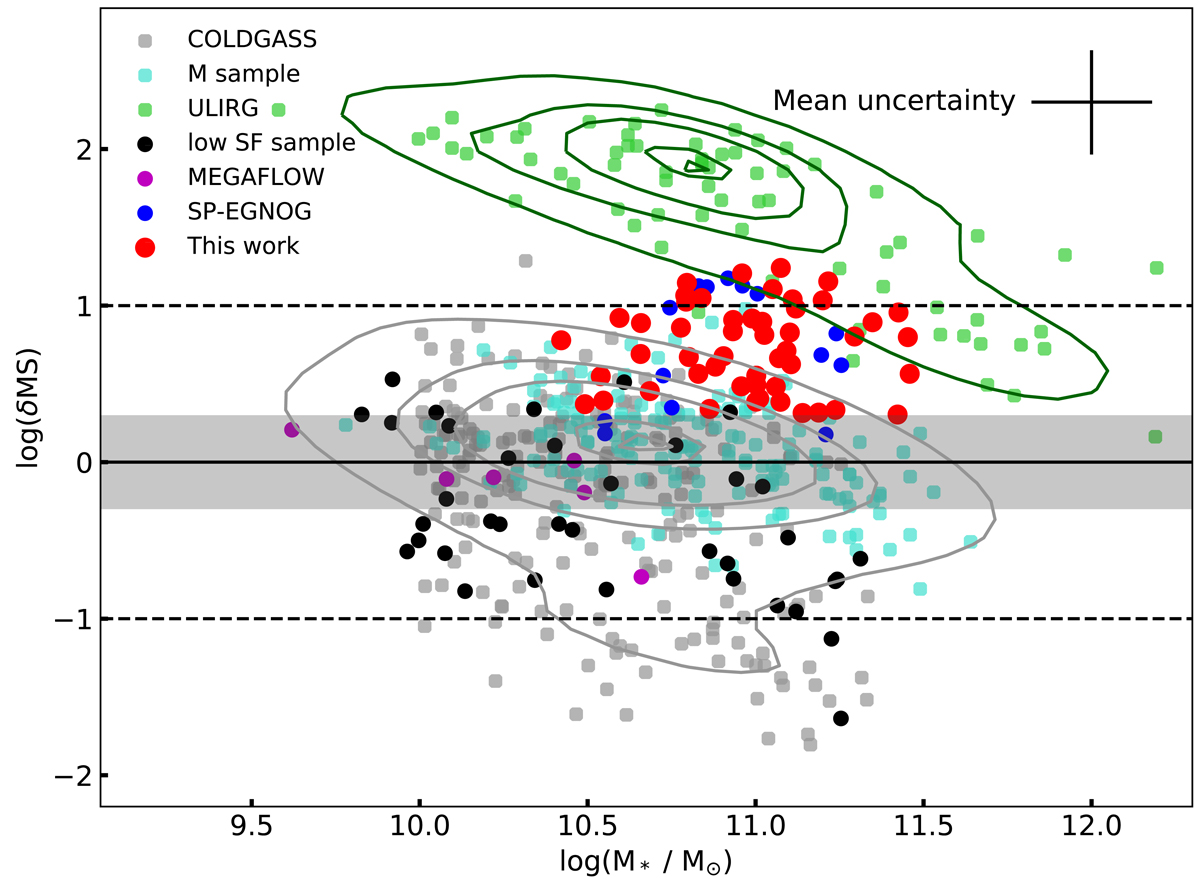
Fig. 2.
Download original image
Offset from MS as in Fig. 1. We show the DP sample with red dots, the SP-EGNOG sample with blue dots, the COLD GASS sample with grey dots, the low-SF sample with black dots, the ULIRG sample with green dots, the M sample with turquoise dots, and the MEGAFLOW sample with magenta dots. The literature samples are introduced in Sects. 2.2.1–2.2.6 and a detailed description of the MS is given in Sect. 2.3. We show contour lines for the ULIRG sample in green and for the COLD GASS sample combined with the M sample in grey. In the top right, we show the mean uncertainties of all samples and discuss the individual uncertainties for each sample in the text.
Current usage metrics show cumulative count of Article Views (full-text article views including HTML views, PDF and ePub downloads, according to the available data) and Abstracts Views on Vision4Press platform.
Data correspond to usage on the plateform after 2015. The current usage metrics is available 48-96 hours after online publication and is updated daily on week days.
Initial download of the metrics may take a while.