Fig. A.1.
Download original image
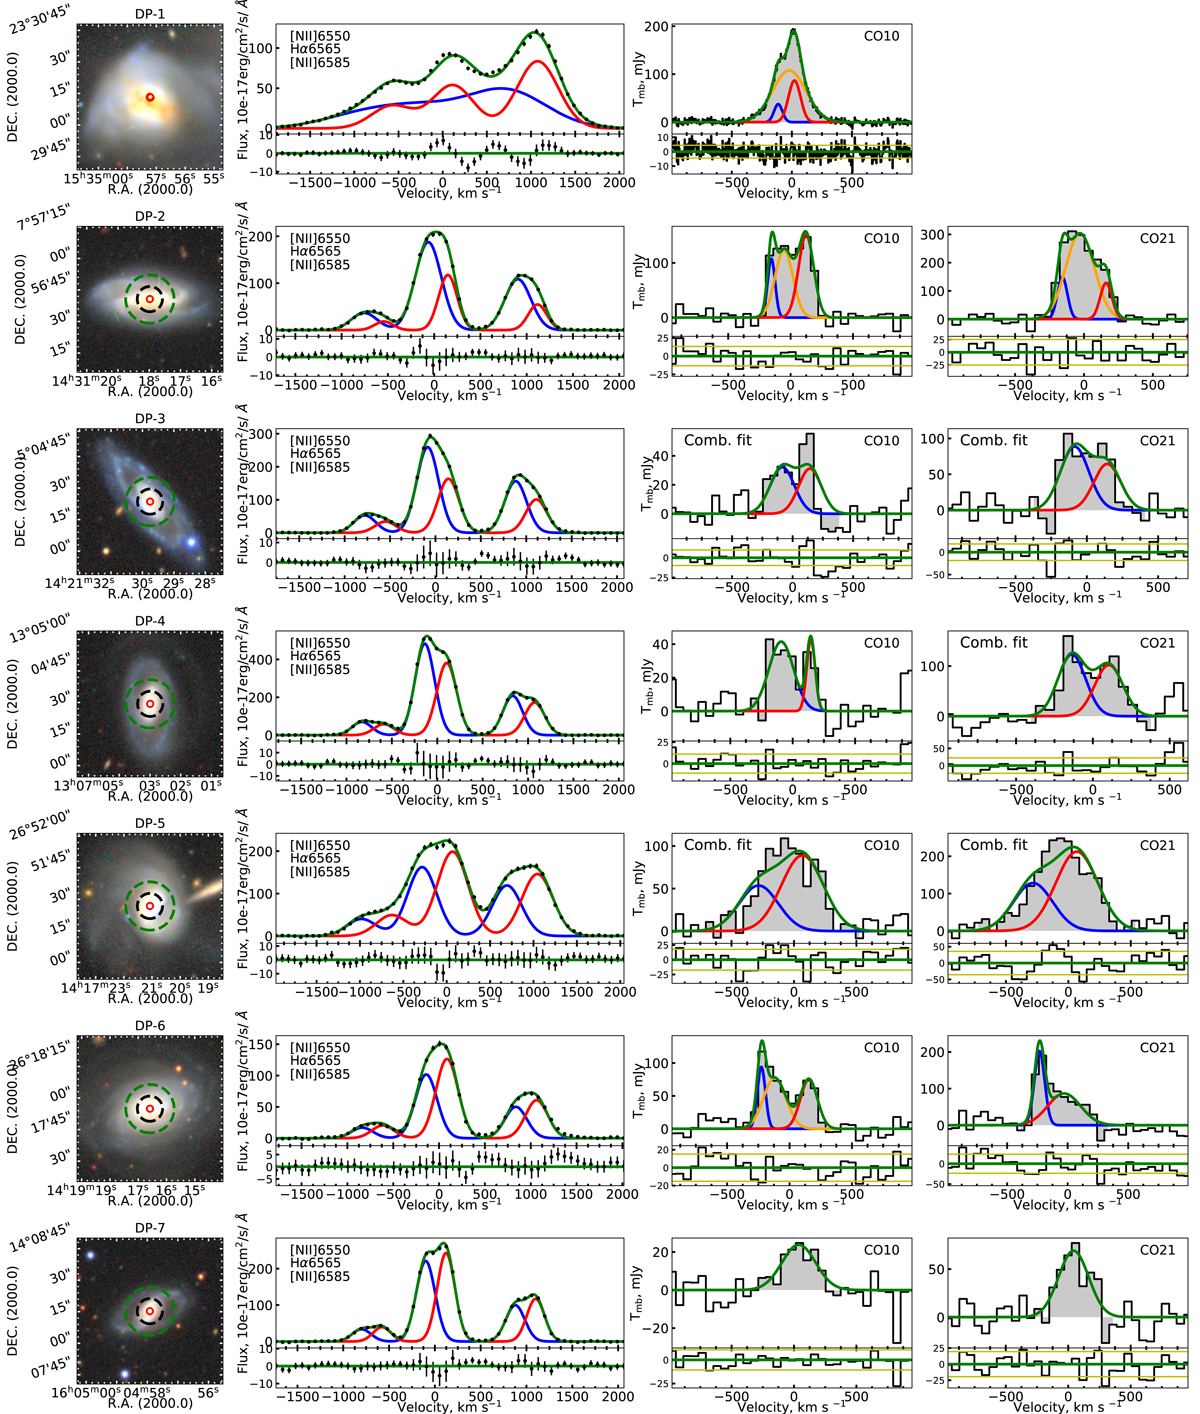
Fit results of ionised-gas emission lines and CO(1-0)/CO(2-1) lines. On the left, we show the 70″ × 70″ legacy survey snapshots (Dey et al. 2019) and mark the position of the SDSS 3″ fibre in red and the IRAM CO(1-0) (resp. CO(2-1)) beam of 23″ (resp. 12″) with a green (resp. black) dashed line. For interferometry observations conducted by Bauermeister et al. (2013), we show the beam with a blue ellipse. For DP-24, DP-25, and DP-31, we show the FCRAO CO(1-0) beam of 50″. For DP-1, we extracted a CO(1-0) signal from ALMA interferometry observations for the exact same area as the SDSS 3″ fibre. Next to the snapshots, we show the Hα emission line and the [NII]λ6550/6585 doublet fitted with a double-Gaussian function. On the right hand side, we show the CO(1-0) and the CO(2-1) line, if observed, fitted by a single, a double, or a triple-Gaussian function. In the case of a successful combined fit as described in Sect. 3.1, we indicate this in the top left of the CO panels. For a detailed description of the fitting procedure, see Sect. 3.1.
Current usage metrics show cumulative count of Article Views (full-text article views including HTML views, PDF and ePub downloads, according to the available data) and Abstracts Views on Vision4Press platform.
Data correspond to usage on the plateform after 2015. The current usage metrics is available 48-96 hours after online publication and is updated daily on week days.
Initial download of the metrics may take a while.