Fig. 11.
Download original image
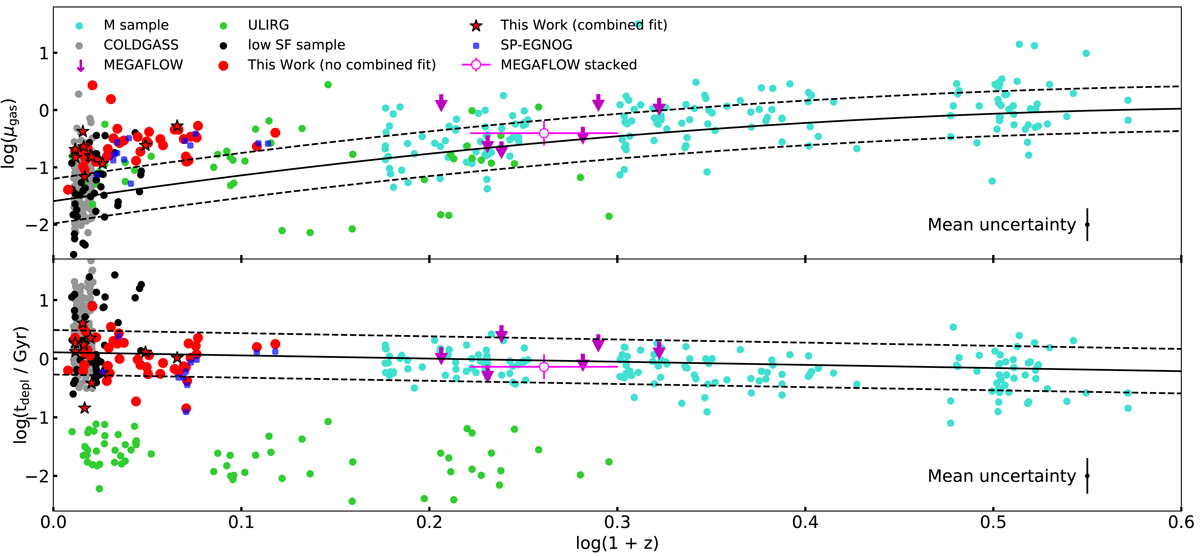
Gas fraction μgas = MH2/M* (top panel) and depletion time tdepl = MH2/SFR (bottom panel) as a function of log(1 + z). We show the observed DP galaxies (red), the EGNOG sample (blue), the COLD GASS sample (grey), the low-SF sample (black), the ULIRG sample (green), the M sample (turquoise), and the detection limits of the MEGAFLOW galaxies (magenta). With an empty circle, we show the estimate based on stacking from Freundlich et al. (2021). The solid black lines represent the scaling relations expected for MS galaxies found by Tacconi et al. (2018), scaled to the mean stellar mass and size of the DP sample (log(M*/M⊙) = 11.0 and Re = 8.3 kpc). The dashed line marks the scatter of 0.4 dex found for the M sample.
Current usage metrics show cumulative count of Article Views (full-text article views including HTML views, PDF and ePub downloads, according to the available data) and Abstracts Views on Vision4Press platform.
Data correspond to usage on the plateform after 2015. The current usage metrics is available 48-96 hours after online publication and is updated daily on week days.
Initial download of the metrics may take a while.