Fig. 10.
Download original image
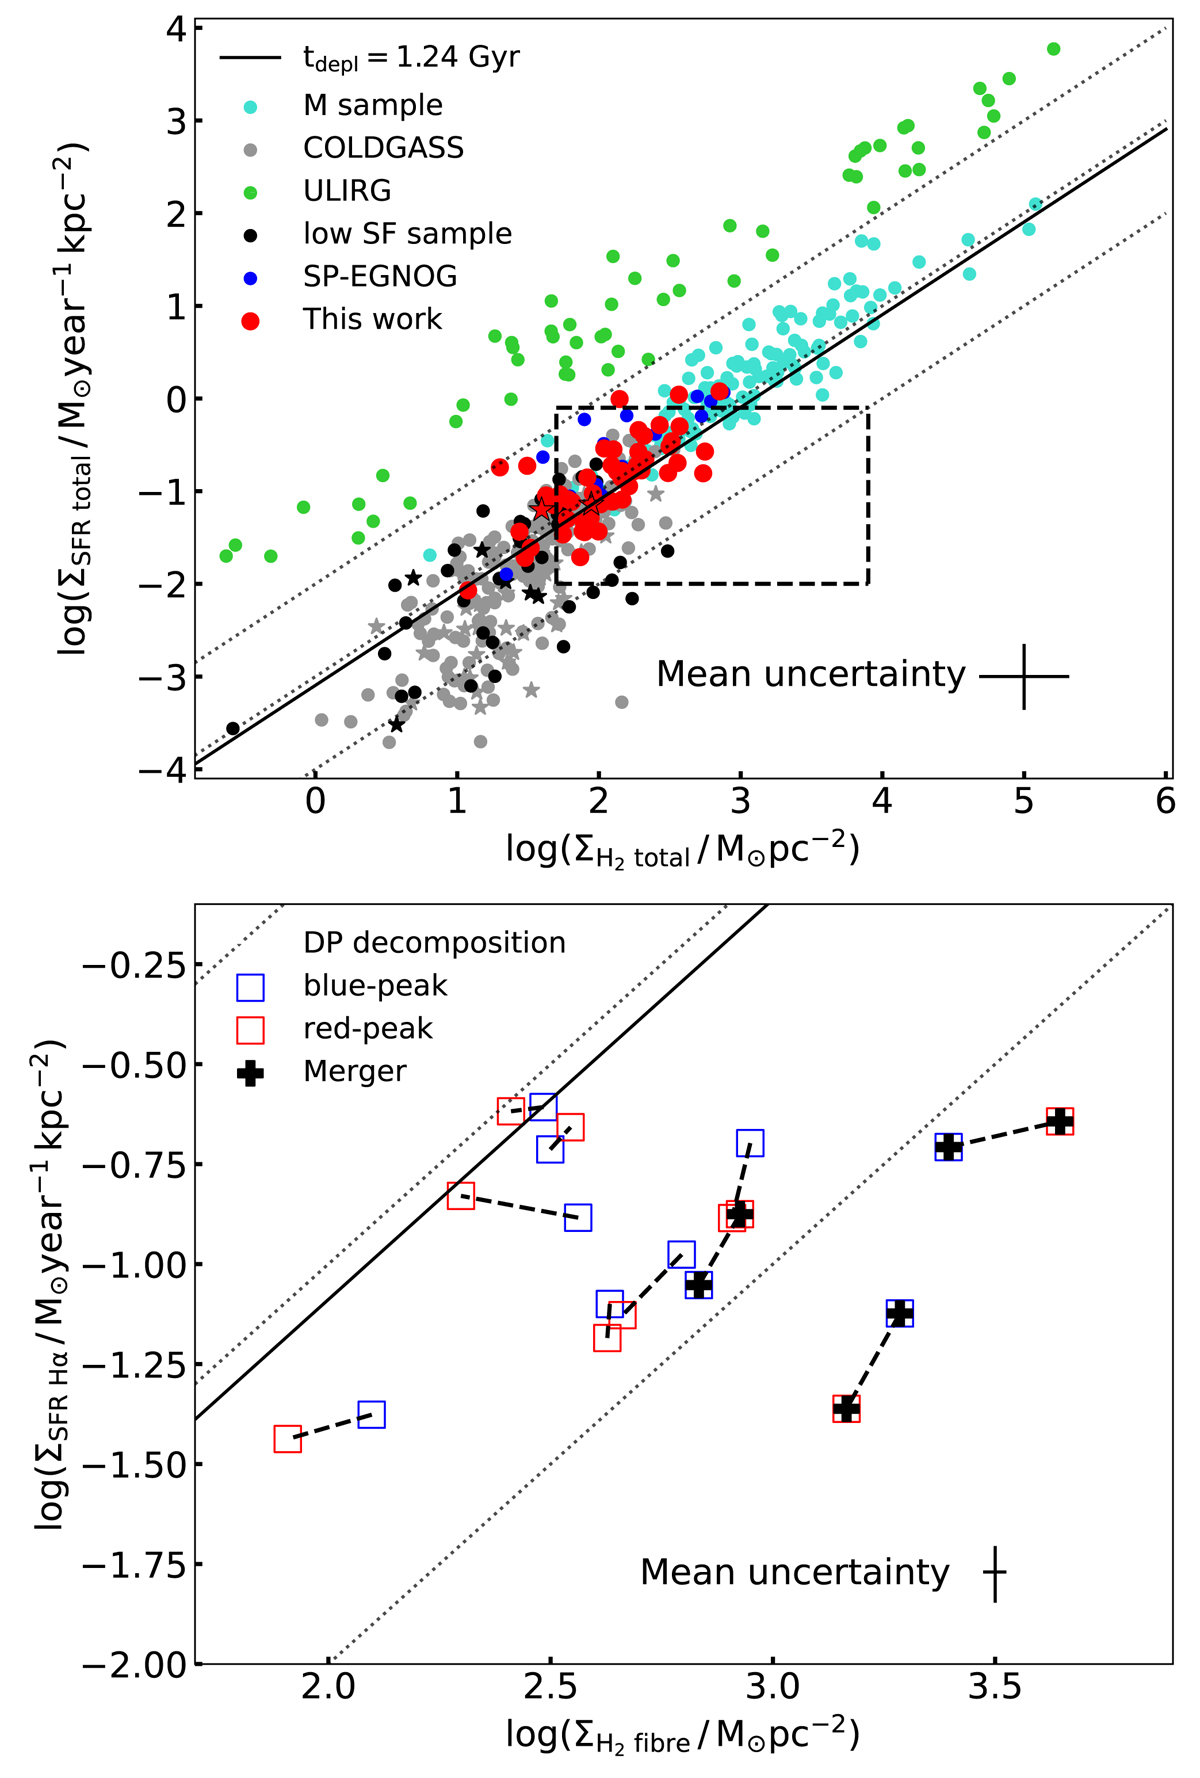
Kennicutt–Schmidt (KS) relation for CO samples. Top panel: KS relation using the total molecular-gas mass and the SFR of the all of the galaxies, and we normalise both quantities using the half-light radii. The DP sample is indicated with red dots, the EGNOG sample with blue dots, the COLD GASS sample with grey dots, the low-SF sample with black dots, the M sample with turquoise dots, and the ULIRG sample with green dots. Galaxies of the low-SF and COLD GASS samples showing AGN activity are marked with stars (see Sect. 3.3.1). Bottom panel: decomposition of the ten DP galaxies for which we succeeded in performing a combined fit (see Sect. 3.1). We show the decomposition in a zoomed-in image of the top panel, which we mark with a dashed box. We display blue (resp. red) squares for the blueshifted (resp. redshifted) component and connect the two components with a black dashed line. We use the SFR estimated by Hα emission of each component and the observed H2 mass of each component and normalise them to the surface of the 3″ SDSS fibre. The three galaxies, classified as mergers, are marked with black plus signs. In both panels, dotted lines denote the constant tdepl of 0.1, 1, and 10 Gyr. The solid black line corresponds to a constant tdepl of 1.24 Gyr estimated using Tacconi et al. (2018) for the mean redshift and stellar mass of the DP sample. In both panels, error bars indicate the mean estimated uncertainties. However, in the lower panel, uncertainties estimated from the surface measurement are not included.
Current usage metrics show cumulative count of Article Views (full-text article views including HTML views, PDF and ePub downloads, according to the available data) and Abstracts Views on Vision4Press platform.
Data correspond to usage on the plateform after 2015. The current usage metrics is available 48-96 hours after online publication and is updated daily on week days.
Initial download of the metrics may take a while.