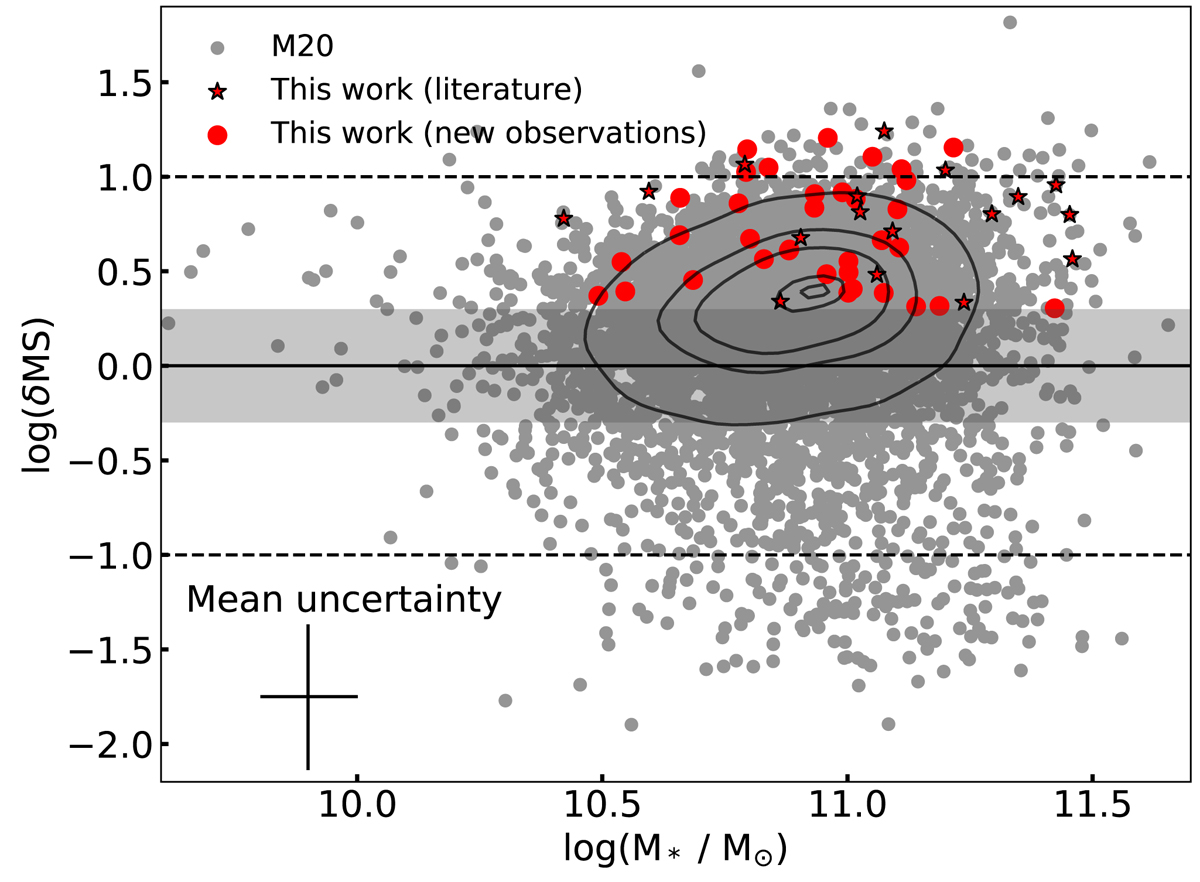
Fig. 1.
Download original image
Offset from MS for all CO samples as a function of stellar mass (M*) using the parametrisation of the MS found by Speagle et al. (2014). The shaded area marks the 0.3 dex and the dashed lines the ±1 dex scatter. We used the SFR computed by Brinchmann et al. (2004) and the stellar mass from Kauffmann et al. (2003). We show the M20 sample with grey dots and mark the DP sample (definition in Sect. 2.1) with red circles and stars. Circles represent galaxies with new CO observations and stars represent galaxies for which we obtained the CO measurements from the literature. The contour lines show the density of the M20 sample. In the bottom left, we show the mean uncertainties.
Current usage metrics show cumulative count of Article Views (full-text article views including HTML views, PDF and ePub downloads, according to the available data) and Abstracts Views on Vision4Press platform.
Data correspond to usage on the plateform after 2015. The current usage metrics is available 48-96 hours after online publication and is updated daily on week days.
Initial download of the metrics may take a while.