Fig. 24
Download original image
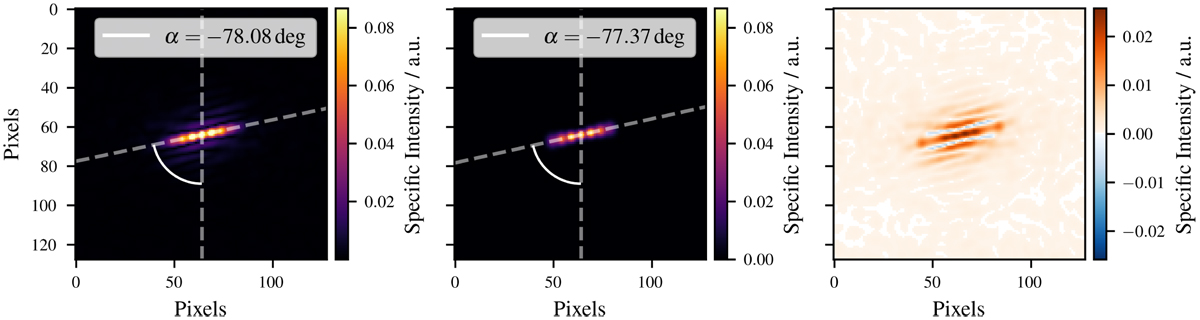
Clean image resulting from the reconstructed amplitude and phase distributions generated by a basic network trained on (64 × 64)-pixel maps without additional fine-tuning. Resulting clean image (left), simulated brightness distribution (middle) and difference between both (right). The jet angle a, which was calculated using a PCA, is given for both source images.
Current usage metrics show cumulative count of Article Views (full-text article views including HTML views, PDF and ePub downloads, according to the available data) and Abstracts Views on Vision4Press platform.
Data correspond to usage on the plateform after 2015. The current usage metrics is available 48-96 hours after online publication and is updated daily on week days.
Initial download of the metrics may take a while.