Fig. 22
Download original image
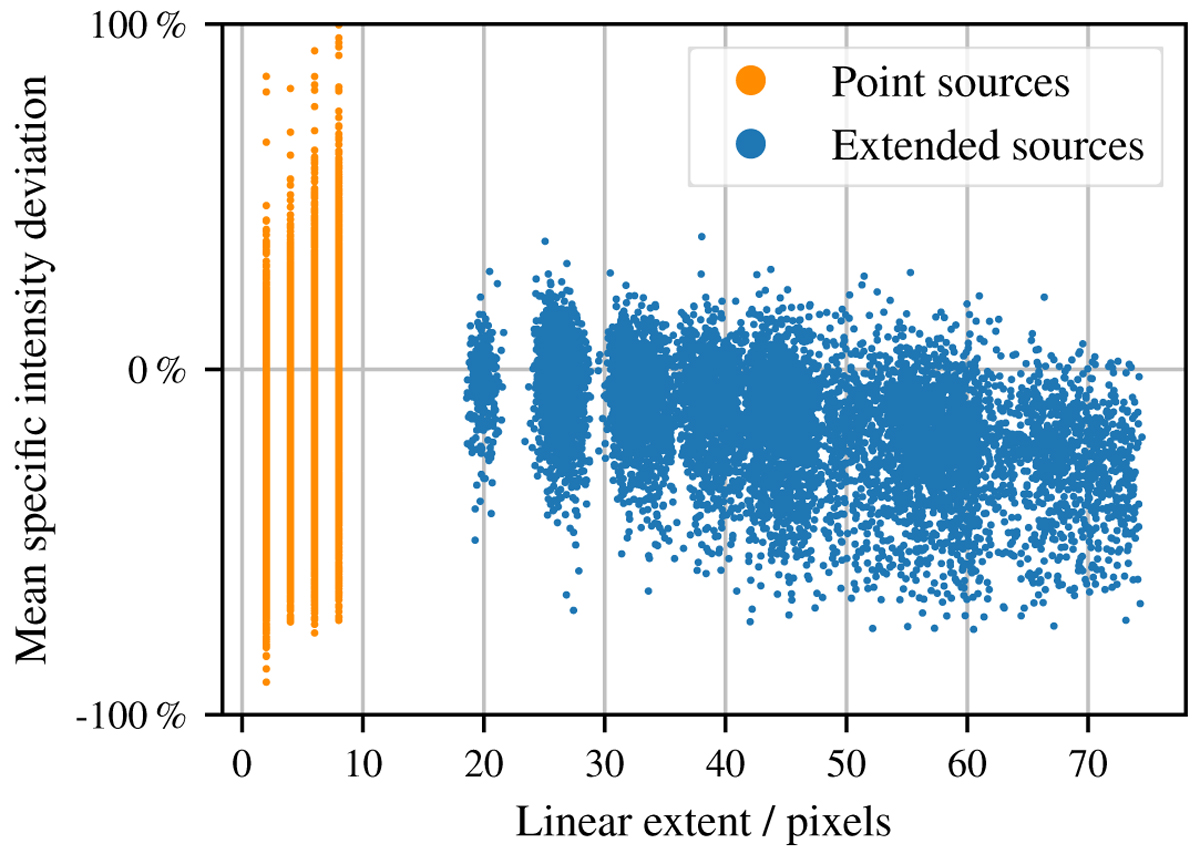
Relation between the linear extent and the mean specific intensity deviation. The orange values are point sources, the blue ones extended sources. The extended sources are underestimated, while there is not clear trend for the point sources. If Fig. 21 is included, it becomes clear that the majority of the sources is underestimated and only some outliers overestimated.
Current usage metrics show cumulative count of Article Views (full-text article views including HTML views, PDF and ePub downloads, according to the available data) and Abstracts Views on Vision4Press platform.
Data correspond to usage on the plateform after 2015. The current usage metrics is available 48-96 hours after online publication and is updated daily on week days.
Initial download of the metrics may take a while.