Free Access
Fig. 21
Download original image
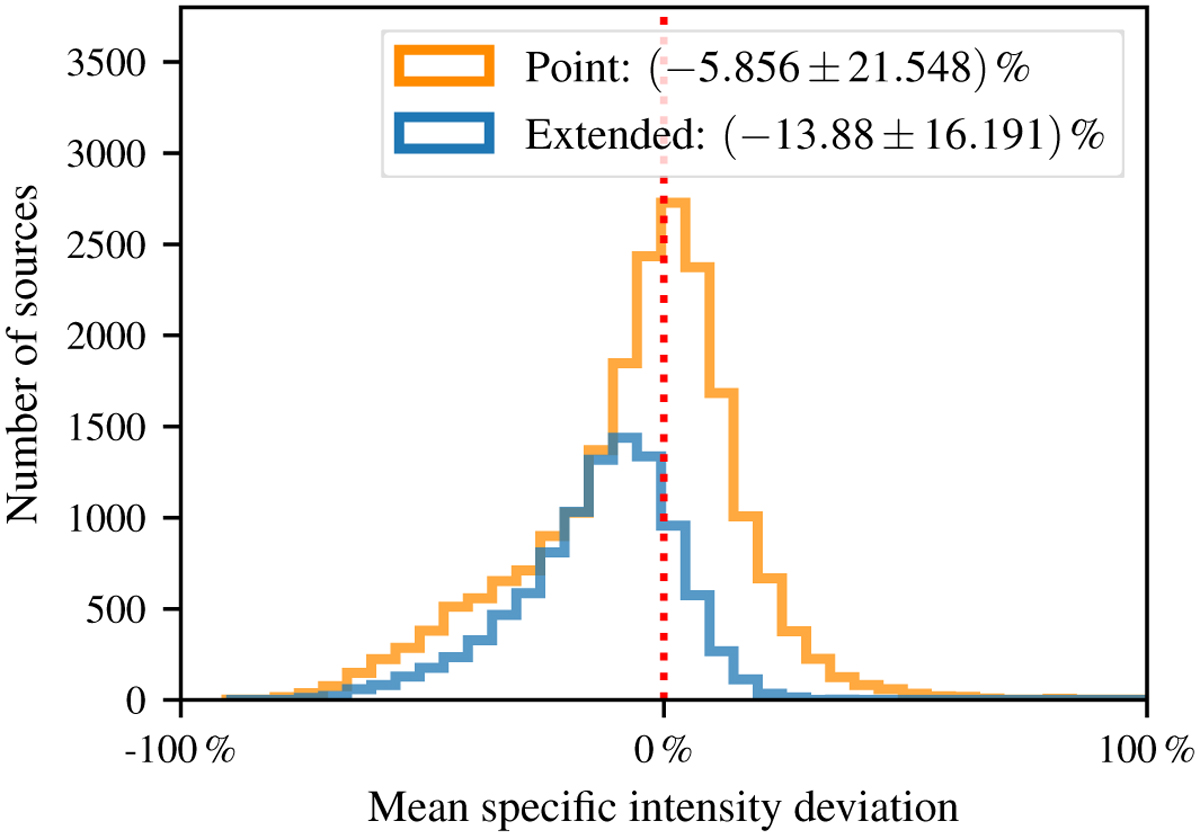
Histogram of the mean specific intensity deviation for the point-like and extended Gaussian sources contained in 10 000 test images. The majority of the sources’ flux is underestimated, as confirmed by the mean value of (−5.865 ± 21548)% for the point sources and (−13.88 ± 16191)% for the extended sources.
Current usage metrics show cumulative count of Article Views (full-text article views including HTML views, PDF and ePub downloads, according to the available data) and Abstracts Views on Vision4Press platform.
Data correspond to usage on the plateform after 2015. The current usage metrics is available 48-96 hours after online publication and is updated daily on week days.
Initial download of the metrics may take a while.