Free Access
Fig. 12
Download original image
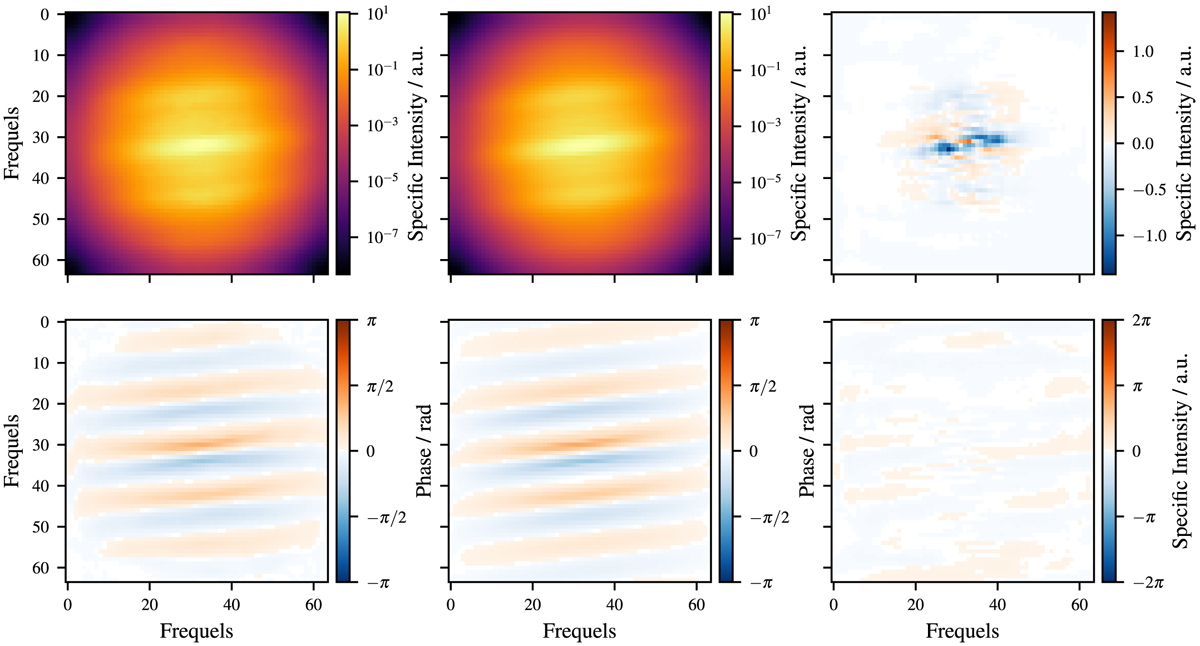
Exemplary reconstruction for the training session with noisy input data Vnoisy. Visualization of prediction (left), true distribution (middle) and the difference between both (right). Results are shown for amplitude (top) and phase (bottom).
Current usage metrics show cumulative count of Article Views (full-text article views including HTML views, PDF and ePub downloads, according to the available data) and Abstracts Views on Vision4Press platform.
Data correspond to usage on the plateform after 2015. The current usage metrics is available 48-96 hours after online publication and is updated daily on week days.
Initial download of the metrics may take a while.