Fig. 8.
Download original image
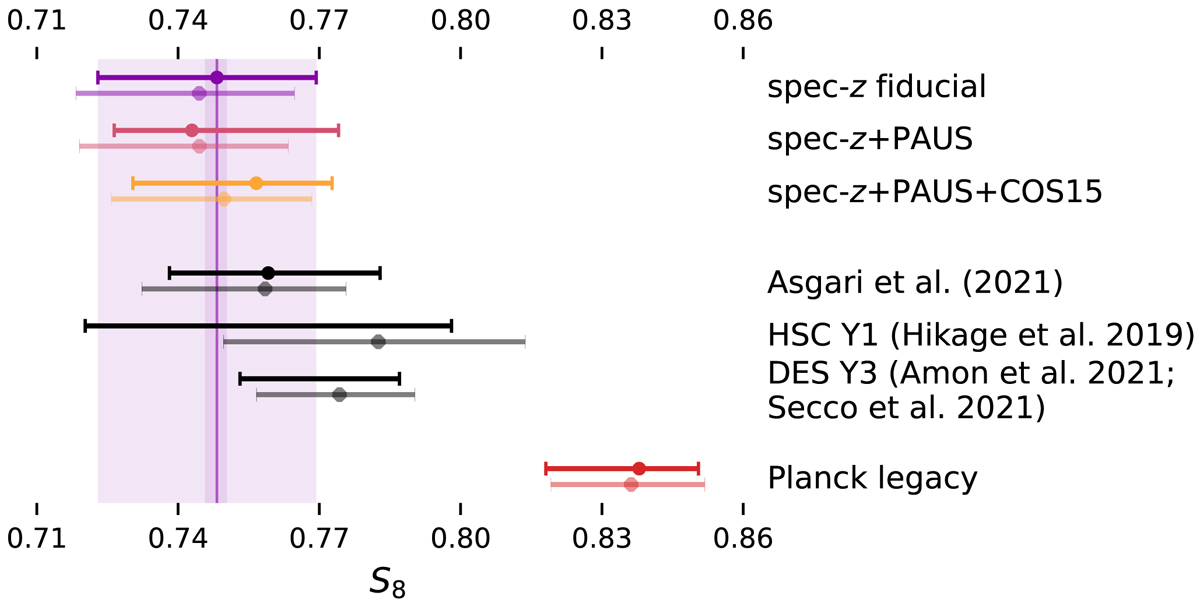
Comparison of the S8 constraints from our gold samples to other studies. We show the best fit (where available) and 68th-percentile PJ-HPD (circles, opaque data points), and the maximum of the marginal distribution and the associated 68th-percentile (diamonds, semi-transparent). We compare to Asgari et al. (2021), HSC-Y1 (Hikage et al. 2019), DES-Y3 (Amon et al. 2022), and Planck legacy. The coloured vertical line and outer bands indicate the constraints from the fiducial gold sample, the inner bands the expected variance of the sampler.
Current usage metrics show cumulative count of Article Views (full-text article views including HTML views, PDF and ePub downloads, according to the available data) and Abstracts Views on Vision4Press platform.
Data correspond to usage on the plateform after 2015. The current usage metrics is available 48-96 hours after online publication and is updated daily on week days.
Initial download of the metrics may take a while.