Open Access
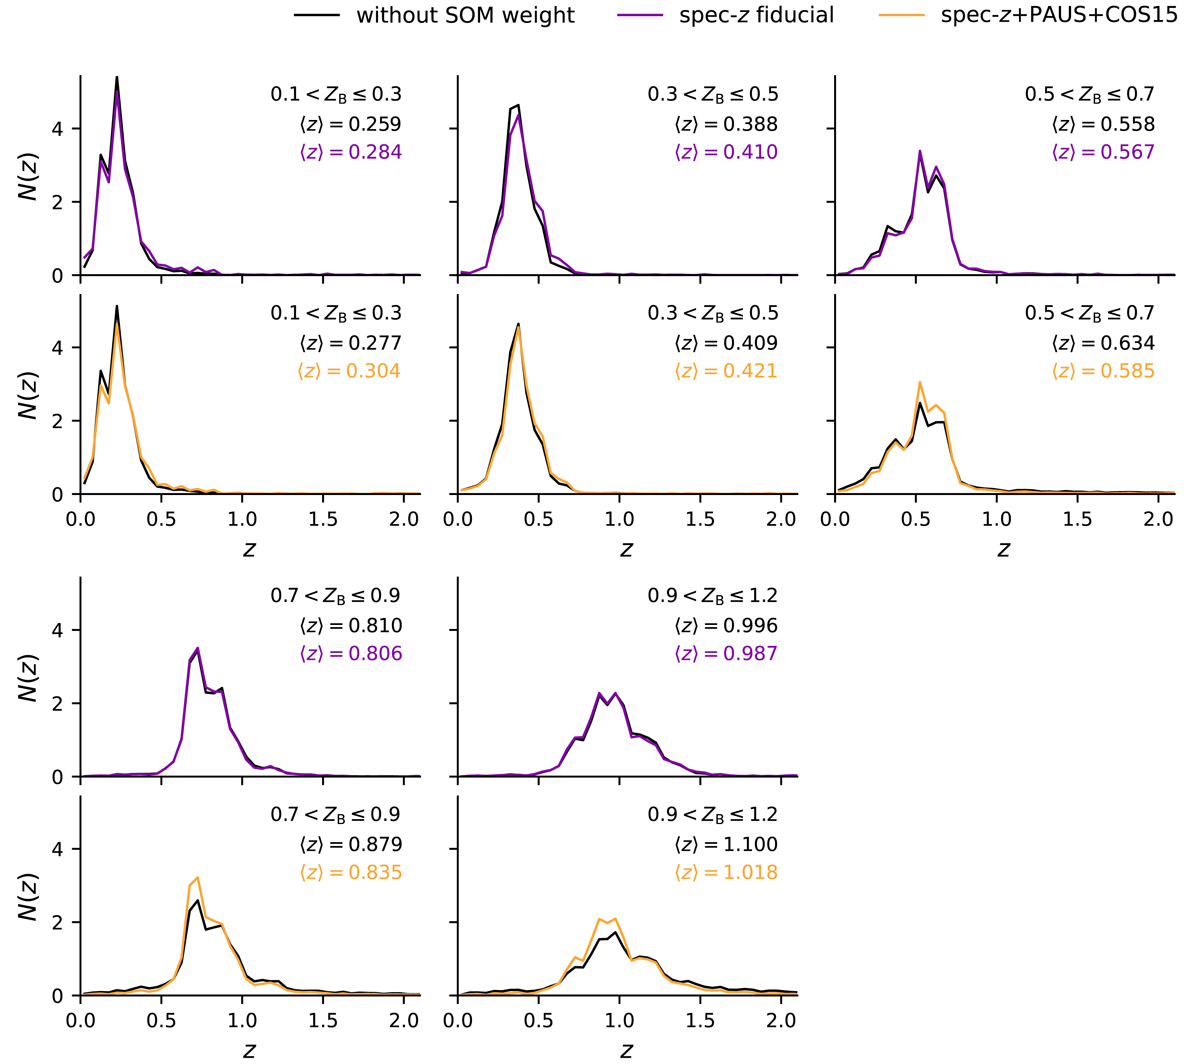
Fig. 6.
Download original image
Comparison of the tomographically binned calibration sample (black lines) to the gold sample redshift distributions (coloured lines). The greater the difference between the black and the coloured lines, the more weighting is applied by the SOM to match the calibration sample to the KiDS data.
Current usage metrics show cumulative count of Article Views (full-text article views including HTML views, PDF and ePub downloads, according to the available data) and Abstracts Views on Vision4Press platform.
Data correspond to usage on the plateform after 2015. The current usage metrics is available 48-96 hours after online publication and is updated daily on week days.
Initial download of the metrics may take a while.