Fig. 8
Download original image
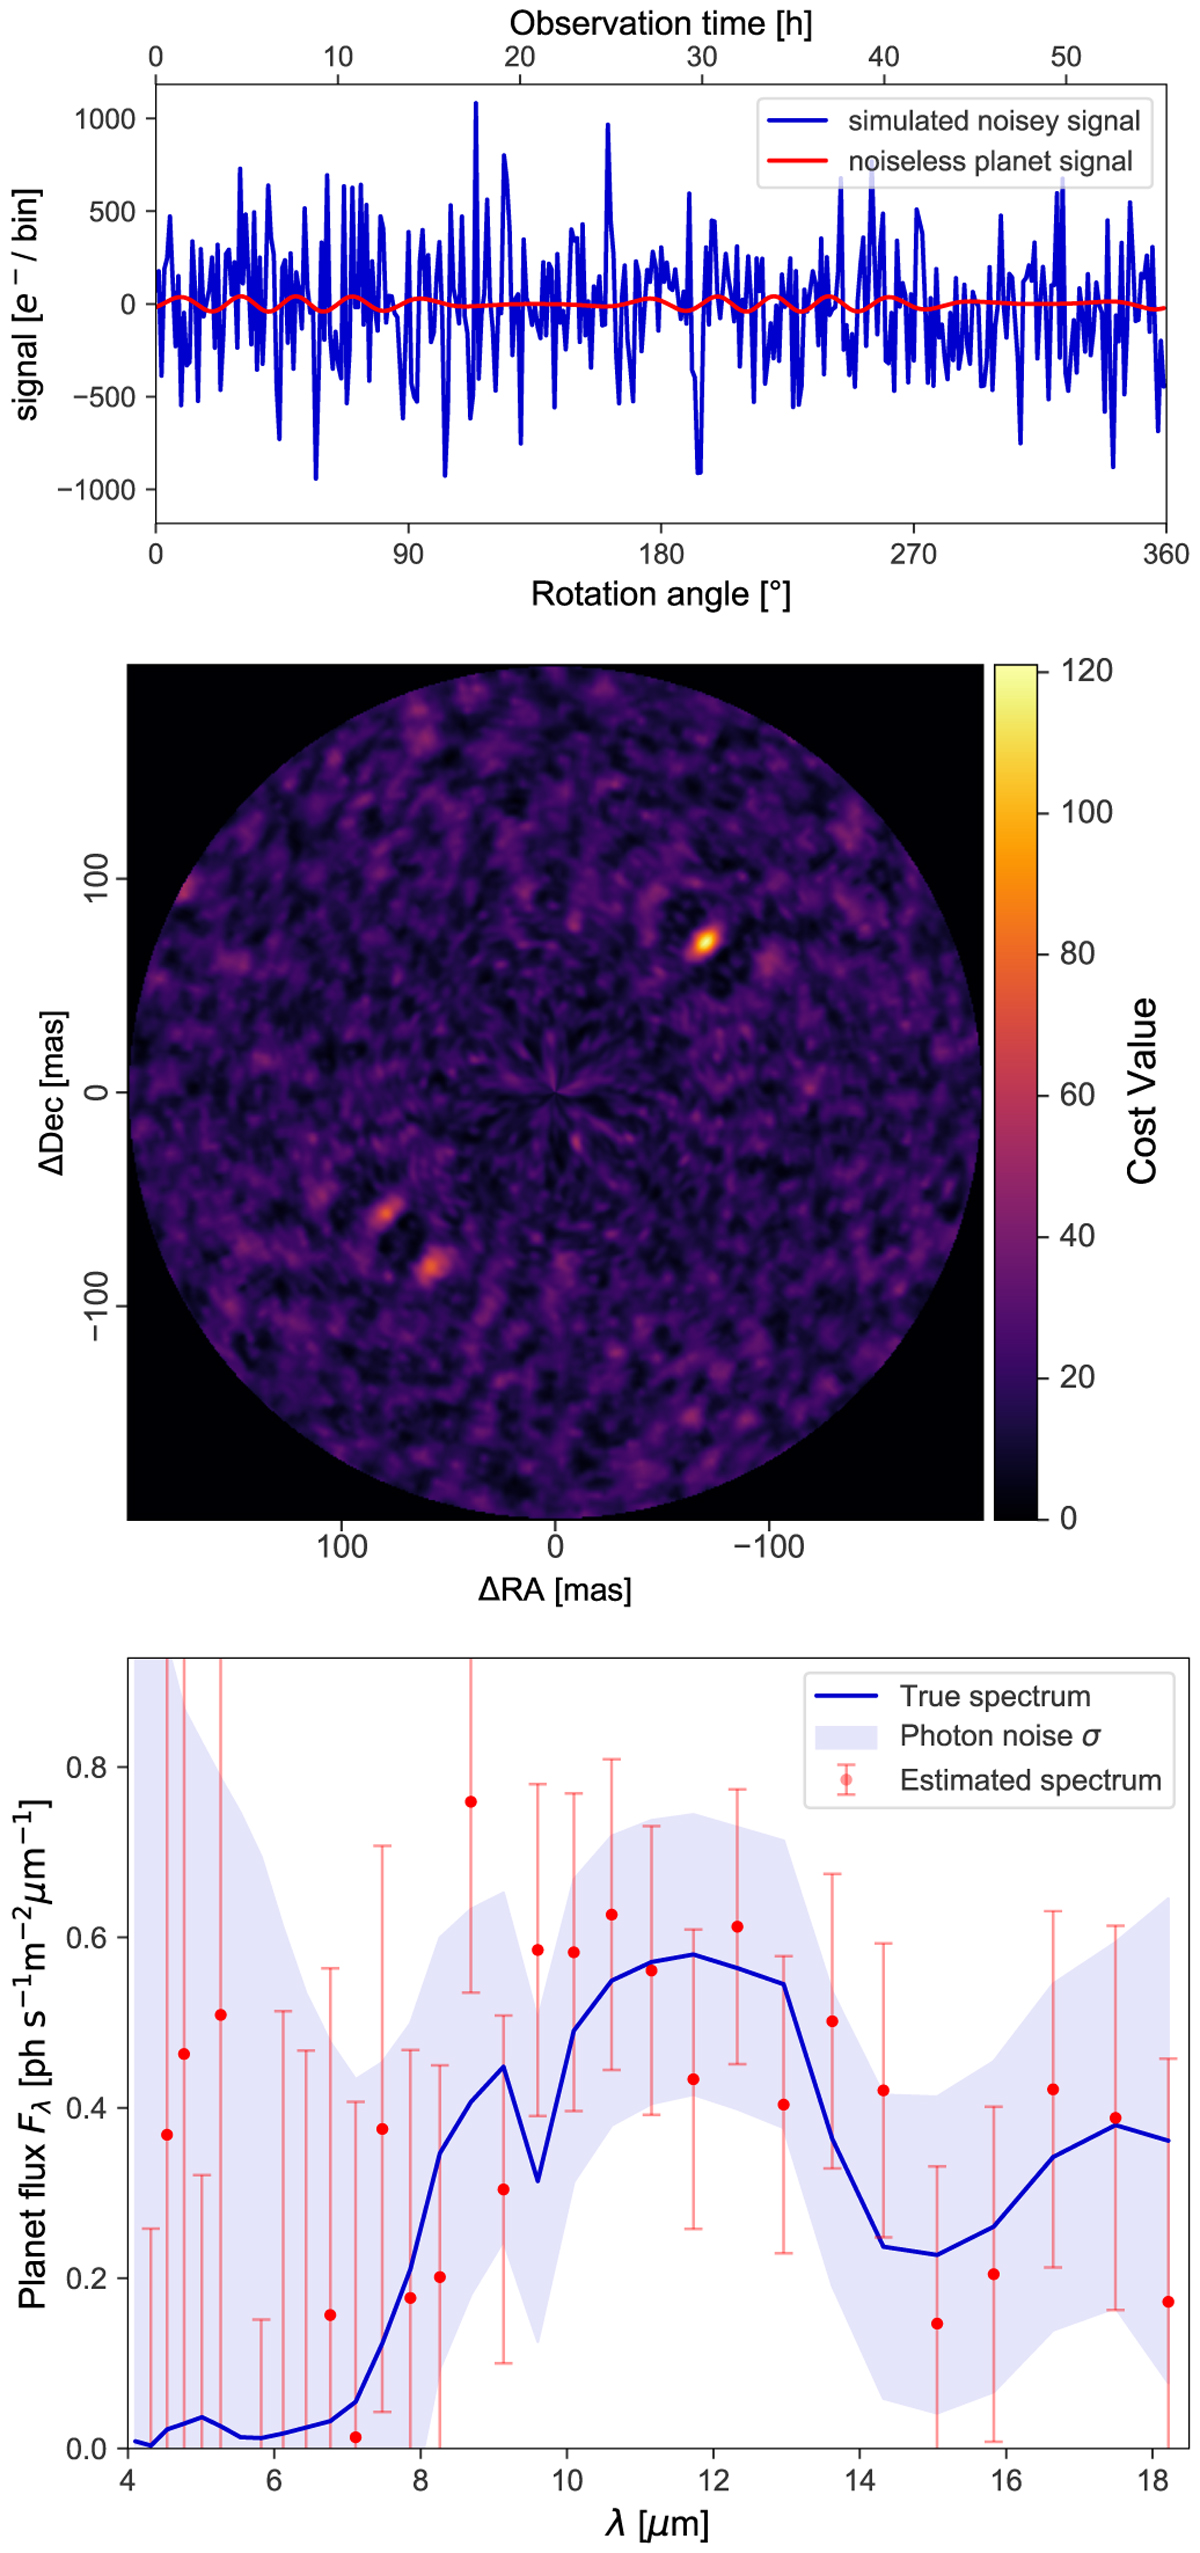
Extraction of spectrum from noisy observation. Top: noisy time series signal from simulated data for an Earth-like planet around a Sun-like star at 10 pc (in blue). The underlying noiseless planet signal is indicated by the red curve. Middle: detection map for simulated data of the Earth-like planet. The photon-noise-based S/N is 9.7 (cf. Sect. 2.4). The planet is correctly found in the upper right of the map. Bottom: spectral flux of the Earth-like planet as estimated from the simulated data (red data points with 1σ error bars). The blue line shows the true flux of the simulated planet, and the blue shaded region indicates ±1σ based on the photon statistics.
Current usage metrics show cumulative count of Article Views (full-text article views including HTML views, PDF and ePub downloads, according to the available data) and Abstracts Views on Vision4Press platform.
Data correspond to usage on the plateform after 2015. The current usage metrics is available 48-96 hours after online publication and is updated daily on week days.
Initial download of the metrics may take a while.