Fig. 7
Download original image
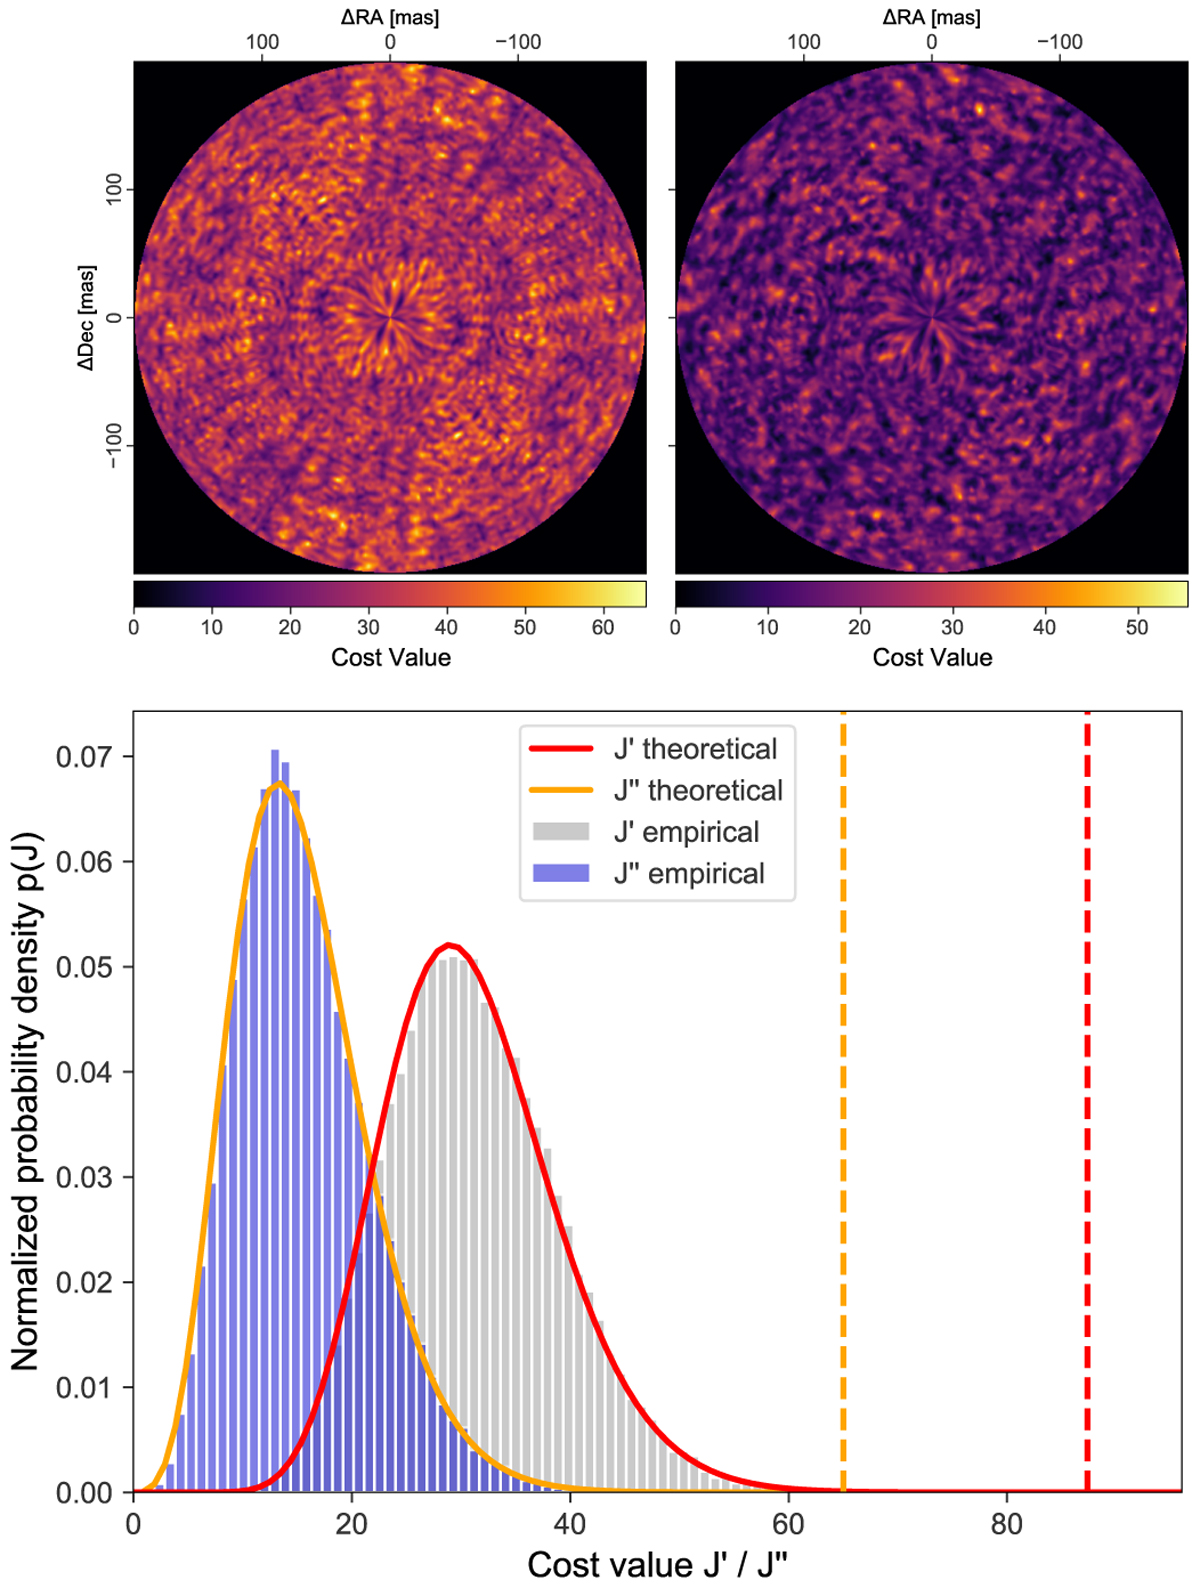
Effect of the positivity constraint of the cost function. Top: different versions of the cost function, J, for a simulated observation without any point sources. L = 31 wavelength bins are used. Top left: J′ without positivity constraint on the flux. The image is point-symmetric with respect to the image center. Top right: J″ with a positivity constraint on the planet flux. Compared to the left image, the strict point symmetry is lifted and the mean value is lower. Bottom: probability distribution of the cost function maps shown above. The gray histogram shows the J′ values obtained from the panel on the top left. The solid red line shows the probability density function of a χ2 distribution with L = 31 degrees of freedom. The blue histogram shows the J″ values obtained from the panel on the top right. The solid orange line shows the theoretically expected distribution of the J″ values given in Eq. (30). The dashed vertical lines indicate the detection criteria of η = 87 and η = 65 as derived by Eq. (28) and Eq. (31), respectively.
Current usage metrics show cumulative count of Article Views (full-text article views including HTML views, PDF and ePub downloads, according to the available data) and Abstracts Views on Vision4Press platform.
Data correspond to usage on the plateform after 2015. The current usage metrics is available 48-96 hours after online publication and is updated daily on week days.
Initial download of the metrics may take a while.