Fig. 5
Download original image
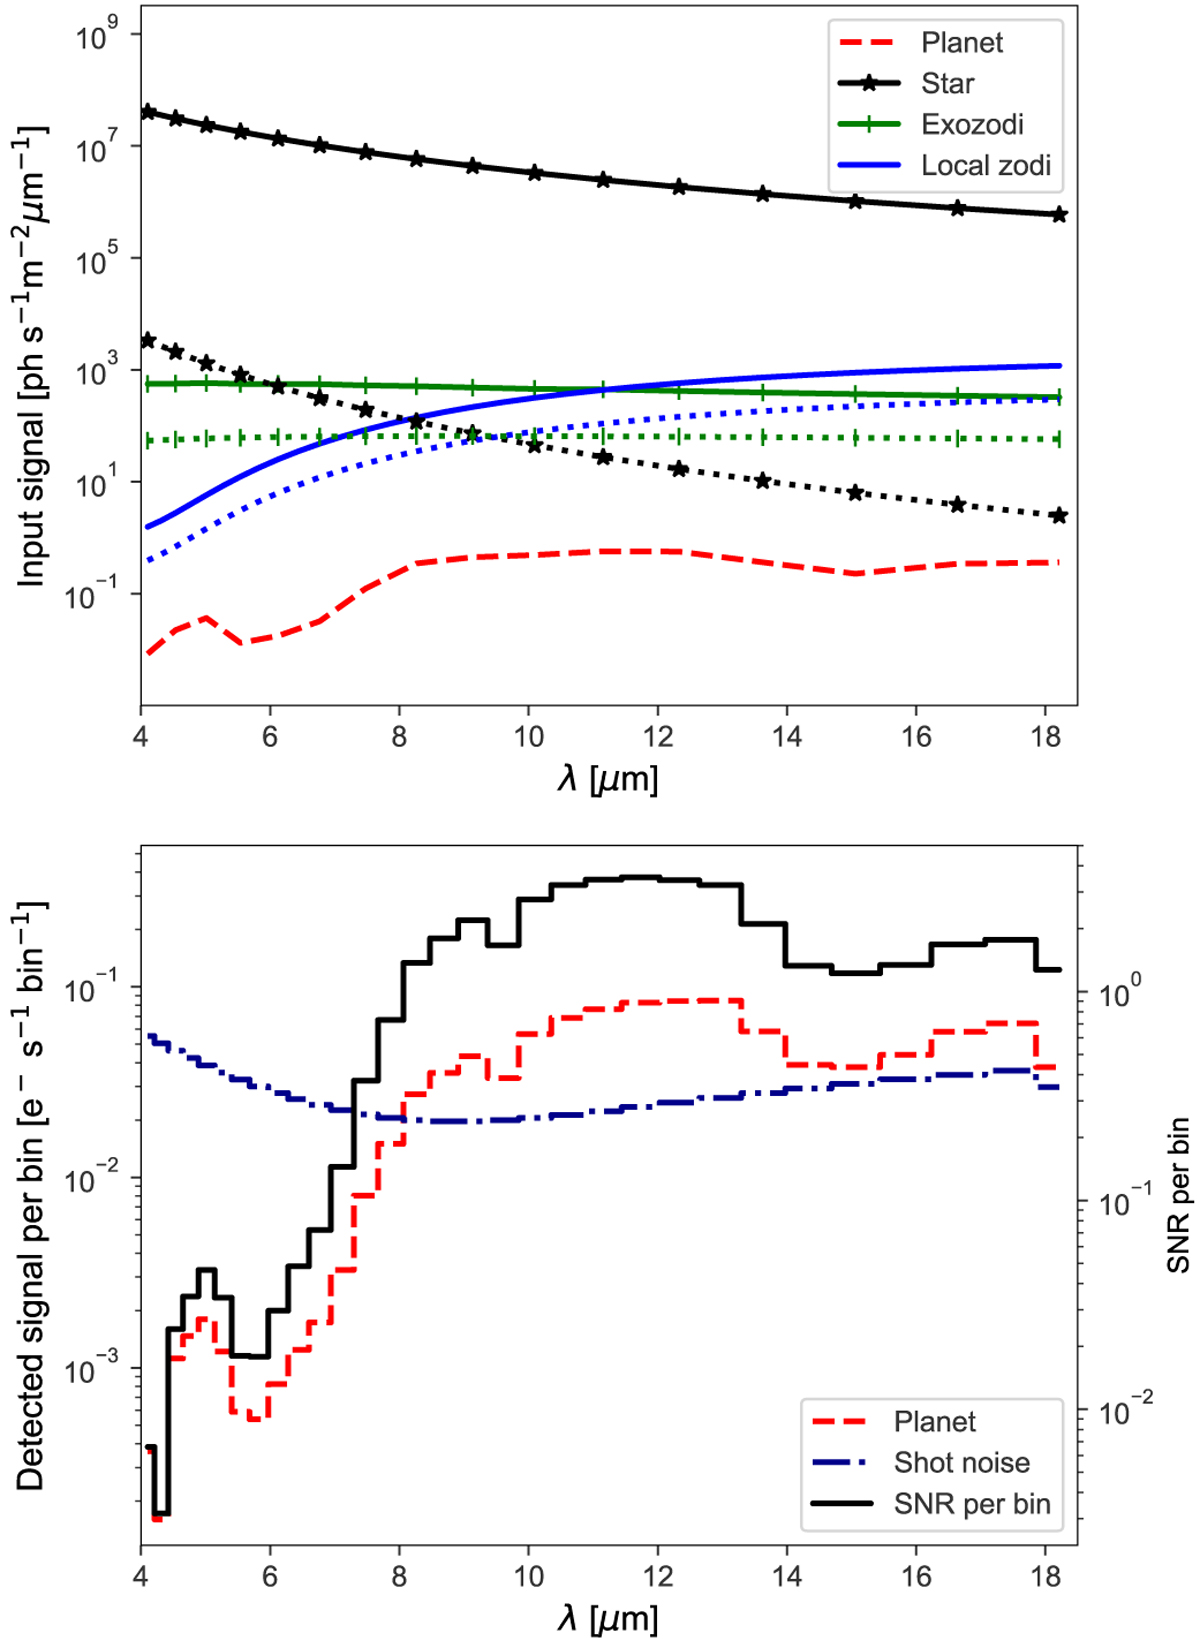
Simulated spectra for the observation of an Earth-twin. Top: comparison of the various input signals in our example of an Earthlike planet at 10 pc. The solid lines indicate the total flux received from the respective sources: planet (red), star (black), exozodiacal dust (gray), and local zodiacal dust (blue). The dotted lines with the same color code indicate the fraction of the flux that contributes to the shot noise. Bottom: detected planet signal (red line) and total shot noise (dashed blue line) averaged over each wavelength bin and for an integration time of 200 000 s (values refer to the y axis on the left). The resulting spectral S/N is shown as the black line and is calculated as described in Sect. 2.3 (values refer to the y axis on the right). Integrated over the full wavelength range, one obtains a S/N ≈ 9.7.
Current usage metrics show cumulative count of Article Views (full-text article views including HTML views, PDF and ePub downloads, according to the available data) and Abstracts Views on Vision4Press platform.
Data correspond to usage on the plateform after 2015. The current usage metrics is available 48-96 hours after online publication and is updated daily on week days.
Initial download of the metrics may take a while.