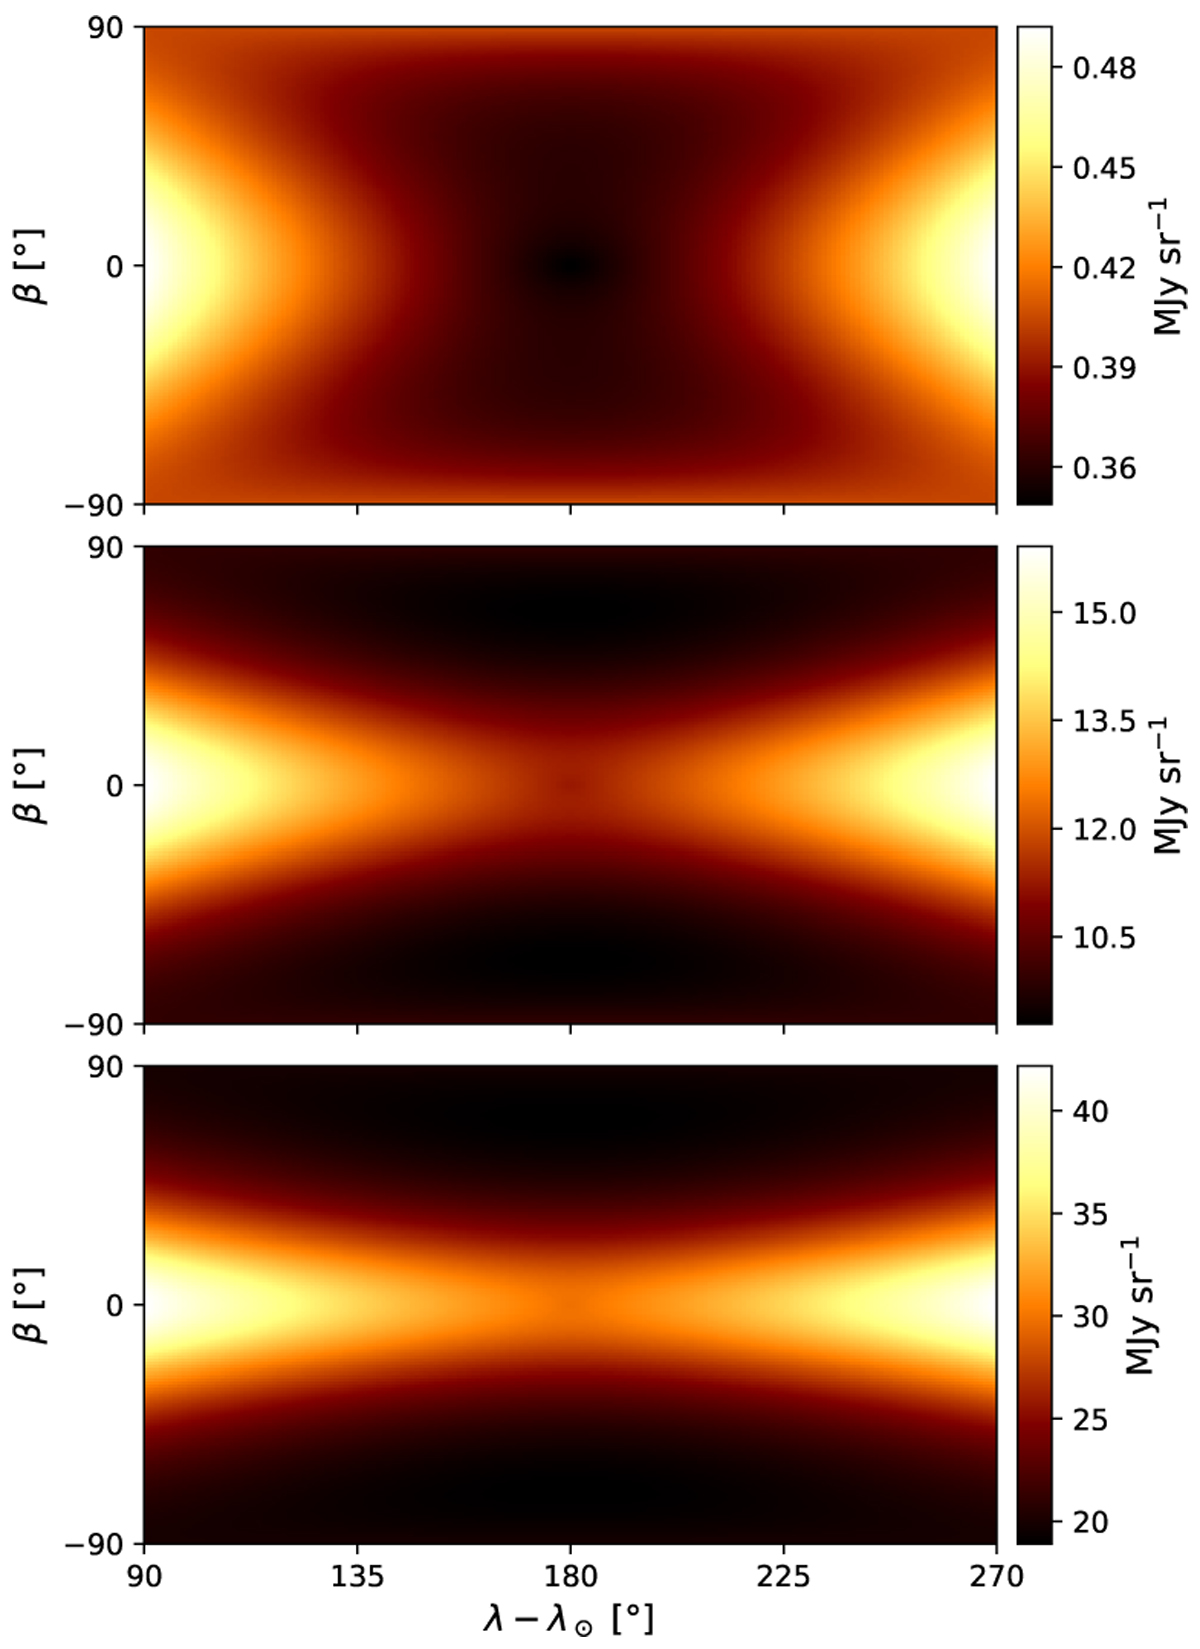
Fig. C.1
Download original image
Surface brightness distribution of the local zodiacal dust cloud for wavelengths of 5 µm, 10 µm, and 20 µm (from top to bottom). The flux is given in MJy sr−1 to allow for a comparison with the DARWIN-SIM technical report (Den Hartog & Karlsson 2005) and other models for the local zodiacal dust, e.g., the one used for sensitivity predictions for the MIRI instrument on board the JWST (Glasse et al. 2015). We note the different color scale for each wavelength.
Current usage metrics show cumulative count of Article Views (full-text article views including HTML views, PDF and ePub downloads, according to the available data) and Abstracts Views on Vision4Press platform.
Data correspond to usage on the plateform after 2015. The current usage metrics is available 48-96 hours after online publication and is updated daily on week days.
Initial download of the metrics may take a while.