Fig. 13
Download original image
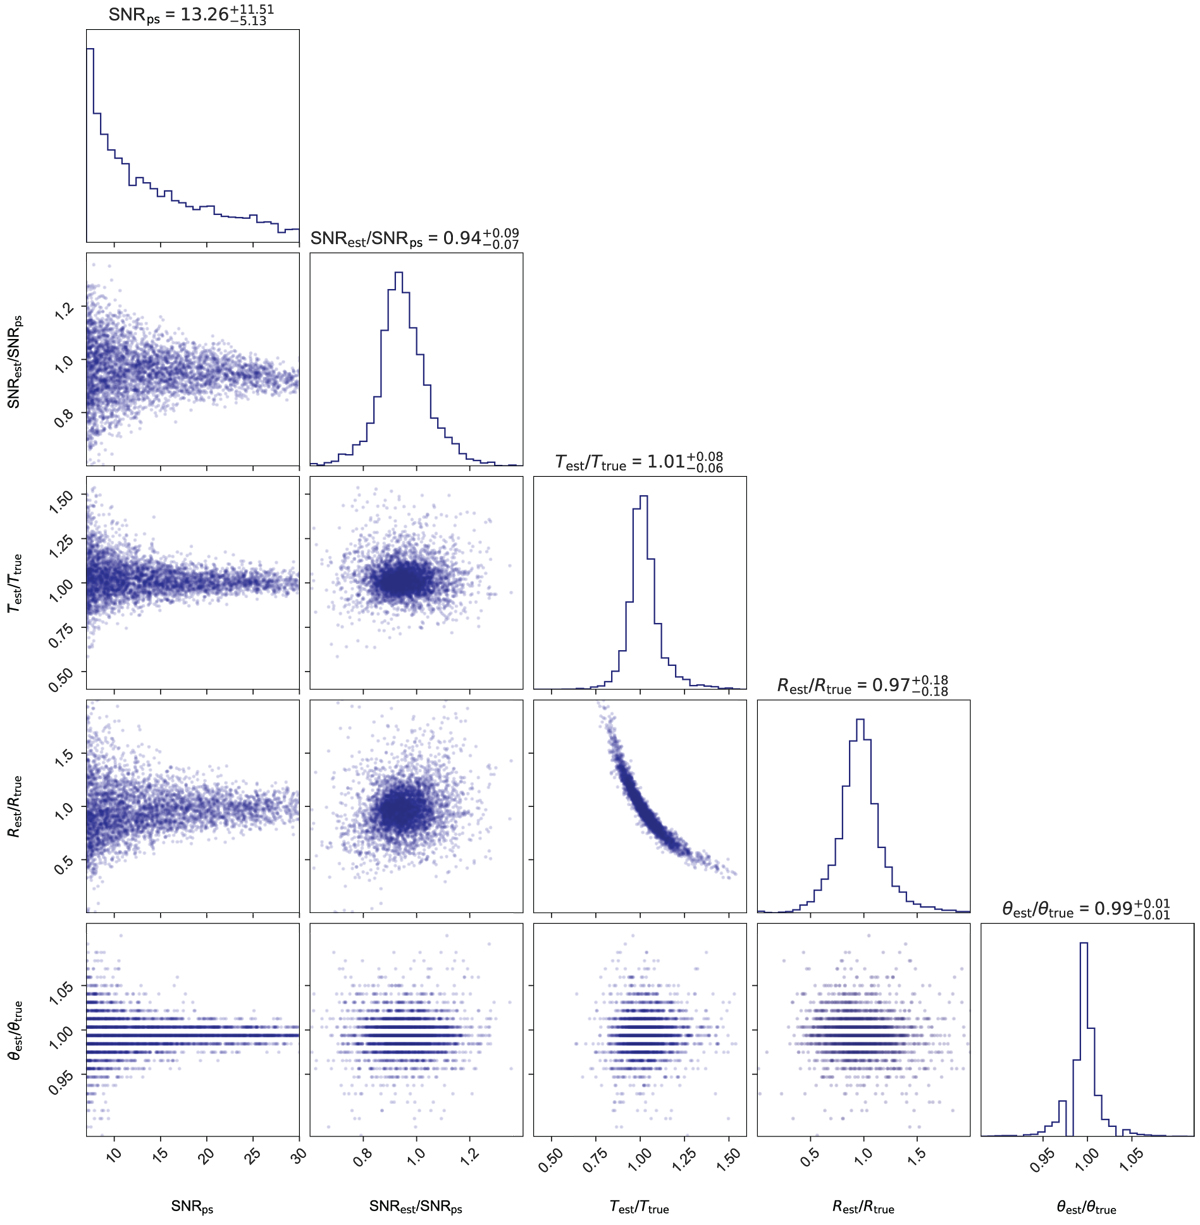
Corner plot showing the predicted S/N based on photon statistics (cf. top panel in Fig. 12) and the estimated values for S/N, temperature, radius, and angular separation relative to the true values based on the signal analysis of ≈4400 rocky, HZ planets. We note that the discretization of the values for the estimated angular separation corresponds to the resolution of the spatial grid on which the analysis was performed. At the top of each column the mean and the standard deviation of the distributions are given.
Current usage metrics show cumulative count of Article Views (full-text article views including HTML views, PDF and ePub downloads, according to the available data) and Abstracts Views on Vision4Press platform.
Data correspond to usage on the plateform after 2015. The current usage metrics is available 48-96 hours after online publication and is updated daily on week days.
Initial download of the metrics may take a while.