Fig. 11
Download original image
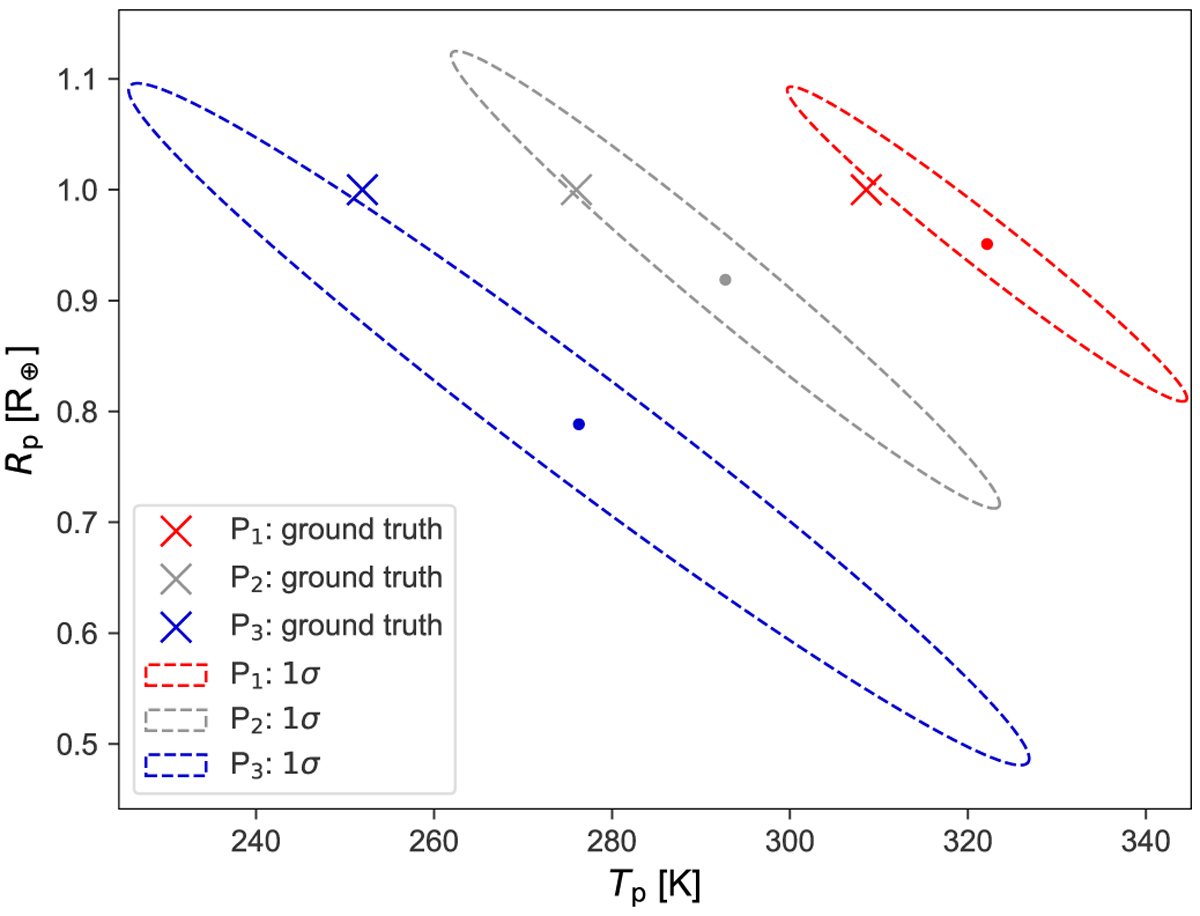
Temperature and radius estimates for the three simulated planets with Rp = 1 R⊕ and varying temperatures. The true values are indicated by crosses and the estimated values by dots with corresponding 1σ confidence ellipses. The values are estimated by fitting a blackbody curve to the estimated spectra of the point sources, whose locations are inferred from the detection maps shown in Fig. 10.
Current usage metrics show cumulative count of Article Views (full-text article views including HTML views, PDF and ePub downloads, according to the available data) and Abstracts Views on Vision4Press platform.
Data correspond to usage on the plateform after 2015. The current usage metrics is available 48-96 hours after online publication and is updated daily on week days.
Initial download of the metrics may take a while.