Fig. 9
Download original image
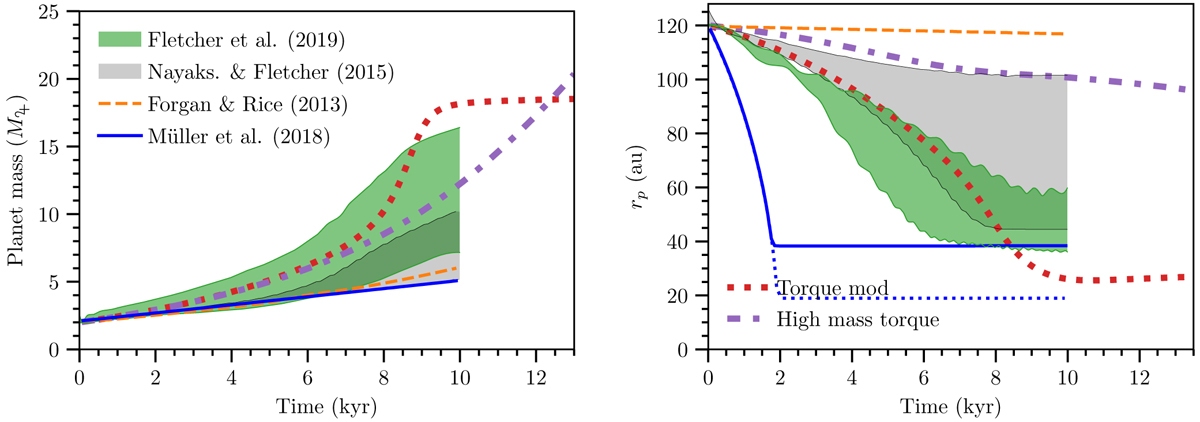
Comparison of our model to results from the code comparison project in FNS19. Evolution of an initially 2 ![]() planet inserted at 120 au. Left: mass vs. time; right: separation vs. time. The green shaded region represents the region of parameter space covered by six different hydrodynamic codes. The results from our calculation are shown as thick dotted and dash-dotted lines (legend in the right panel). Results from different disc instability population synthesis codes are also shown (legend in the left panel). The grey shaded-hatched region corresponds to the region of parameter space covered by Nayakshin & Fletcher (2015). The orange dashed line shows the result from Forgan & Rice (2013). The result from Müller et al. (2018) is shown in blue. The dotted line (covered by the solid line in the left panel) represents a different gap opening criterion (see details in Sect. 4.8).
planet inserted at 120 au. Left: mass vs. time; right: separation vs. time. The green shaded region represents the region of parameter space covered by six different hydrodynamic codes. The results from our calculation are shown as thick dotted and dash-dotted lines (legend in the right panel). Results from different disc instability population synthesis codes are also shown (legend in the left panel). The grey shaded-hatched region corresponds to the region of parameter space covered by Nayakshin & Fletcher (2015). The orange dashed line shows the result from Forgan & Rice (2013). The result from Müller et al. (2018) is shown in blue. The dotted line (covered by the solid line in the left panel) represents a different gap opening criterion (see details in Sect. 4.8).
Current usage metrics show cumulative count of Article Views (full-text article views including HTML views, PDF and ePub downloads, according to the available data) and Abstracts Views on Vision4Press platform.
Data correspond to usage on the plateform after 2015. The current usage metrics is available 48-96 hours after online publication and is updated daily on week days.
Initial download of the metrics may take a while.