Open Access
Fig. B.1
Download original image
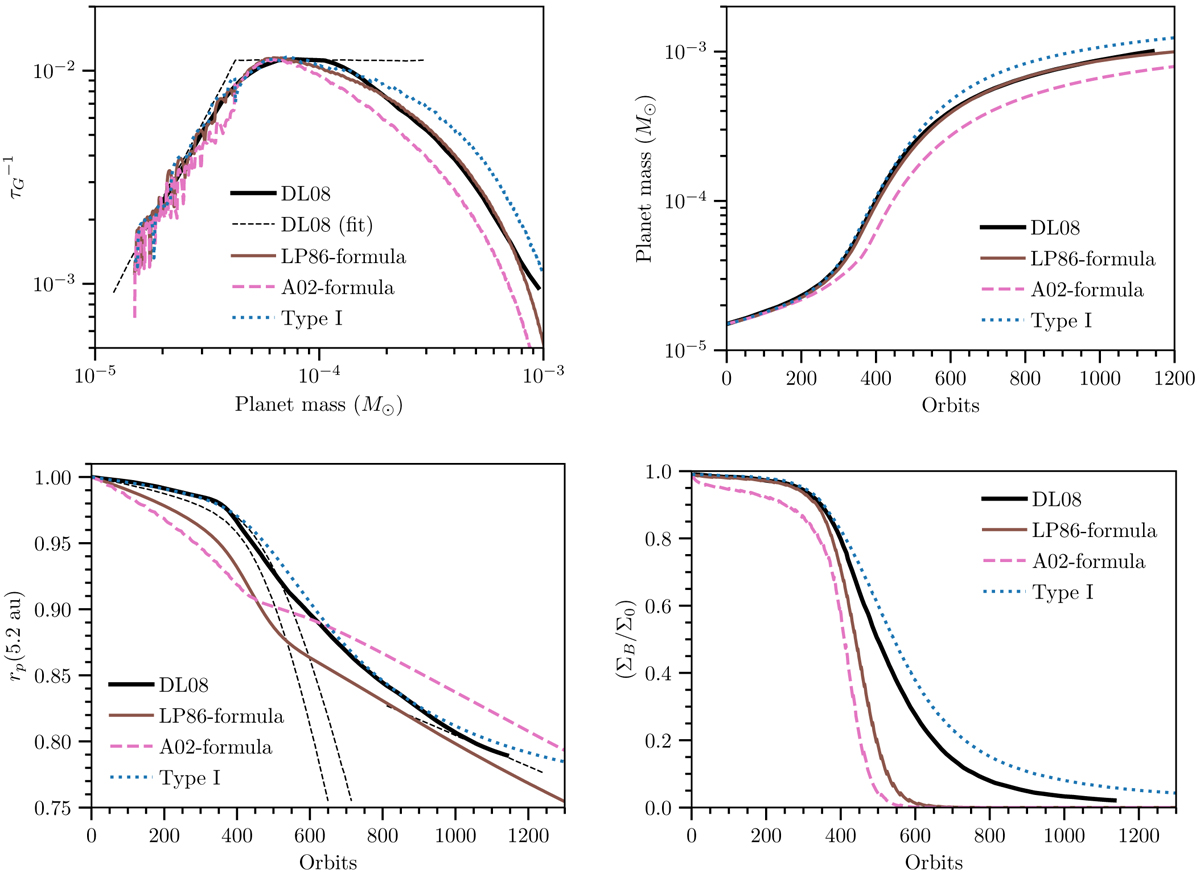
Same as Fig. 4, but for alternative torque models. The solid brown line represents the results from the LP86 formula. The dashed pink line shows the results based on the A02 formula. The blue dotted line gives the results when applying only a type I torque using the surface density at the planet location.
Current usage metrics show cumulative count of Article Views (full-text article views including HTML views, PDF and ePub downloads, according to the available data) and Abstracts Views on Vision4Press platform.
Data correspond to usage on the plateform after 2015. The current usage metrics is available 48-96 hours after online publication and is updated daily on week days.
Initial download of the metrics may take a while.